Spotting a random “Red Flag” here and there is useful, but it’s not a strategy. To truly secure your organic traffic against rendering failures, you need a systematic process, a way to prove indexability before you deploy code, not after your rankings drop.
You know the warning signs from our 8 Red Flags guide. Now let’s turn that knowledge into a rigorous audit.
Whether you’re validating a migration to Next.js, diagnosing a mysterious traffic leak, or just sanity-checking your storefront, this process is designed to be repeatable. It takes you from “I hope Google sees my content” to “I have verified byte-for-byte what the crawler sees.”
When to Audit
You don’t need to do this every day. But there are specific moments when a rendering audit is non-negotiable:
- New Launches & Migrations: Moving from WordPress to Next.js? Launching a new React web app? Audit before you flip the switch.
- Ranking Drops: If traffic dips and your content is quality, the delivery mechanism might be broken.
- Framework Updates: Major version bumps (like upgrading to React 19 or switching bundlers) can introduce subtle rendering race conditions.
- “Invisible” Content: When content is clearly visible to users in a browser, but site search and Google can’t find it.
Phase 1: Preparation
Don’t boil the ocean. You can’t audit every URL on a 10k-page site manually. You need a representative sample.
Select Your Targets:
Pick 5-10 URLs that represent your unique templates:
- Homepage (often unique layout/logic)
- Product/Service Detail Page (the money page)
- Category/Listing Page (often heavy on client-side filtering/pagination)
- Content/Blog Article (text-heavy)
- A page with known issues (if investigating a bug)
Phase 2: The Initial Scan
Open jsbug.org. Enter your first URL.
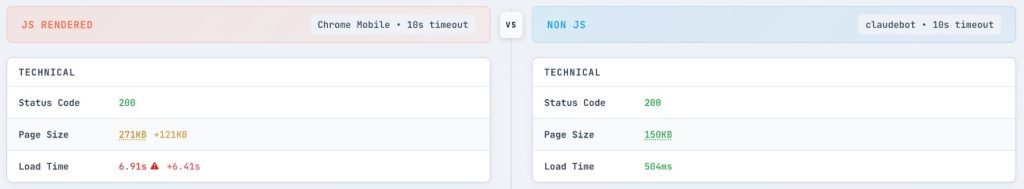
By default, we run two checks simultaneously: one using a standard browser user agent with JavaScript enabled, and one with JavaScript disabled (simulating raw HTML crawlers or a failed render).
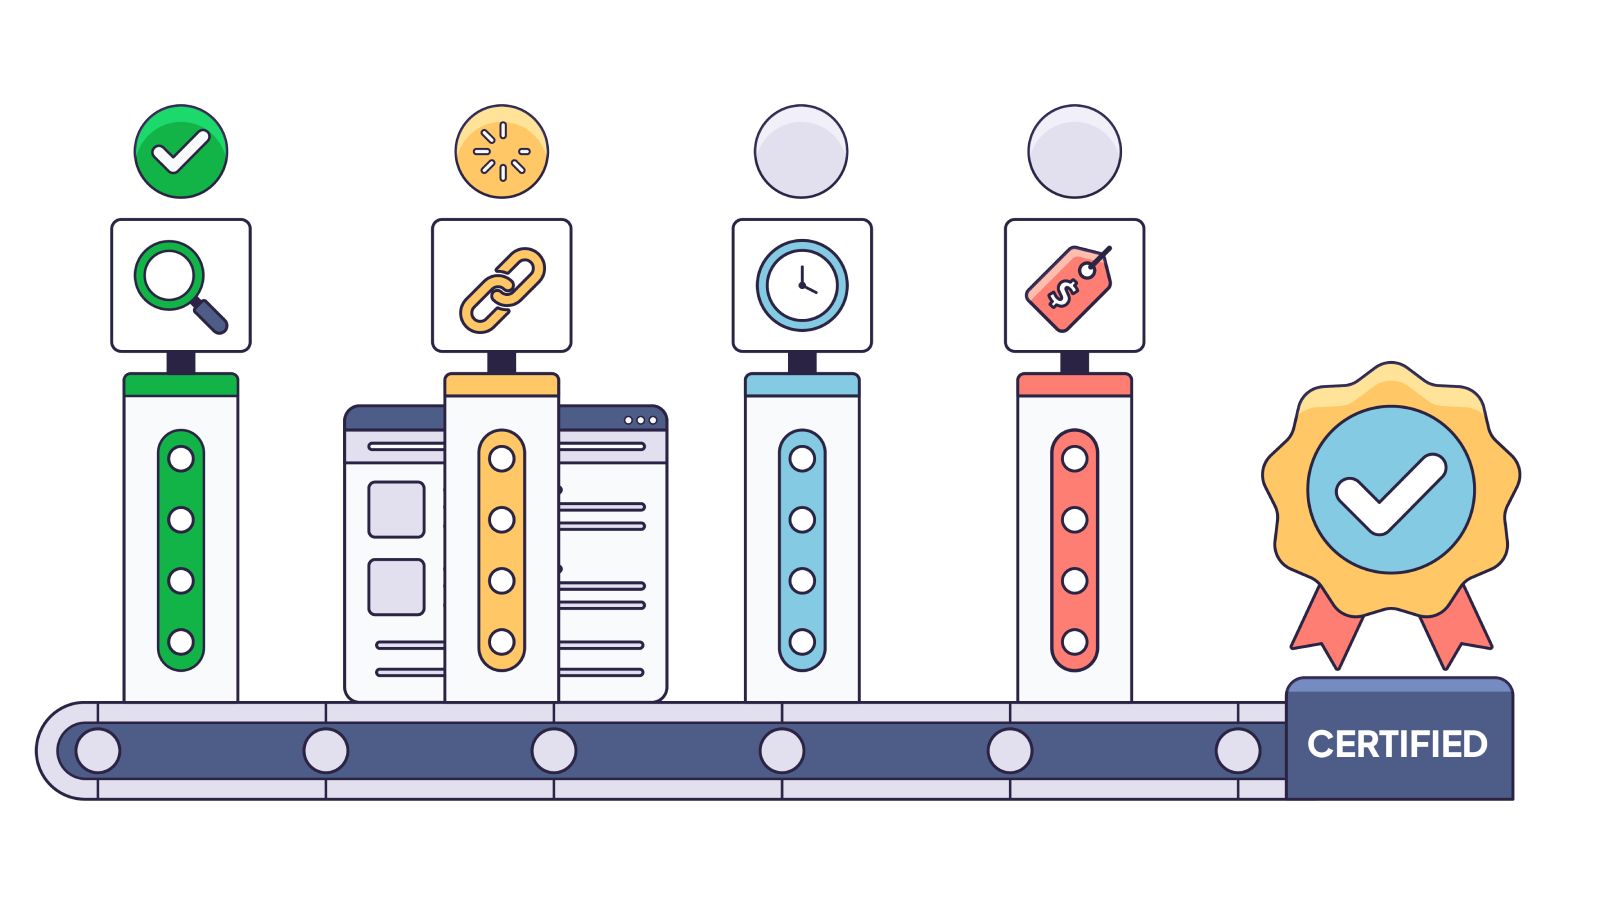
Look at the side-by-side comparison. Check these four critical health signs in order:
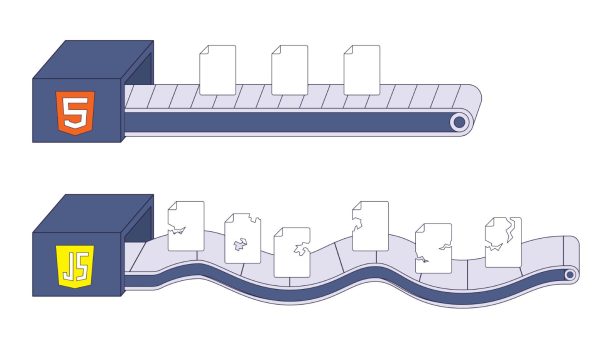
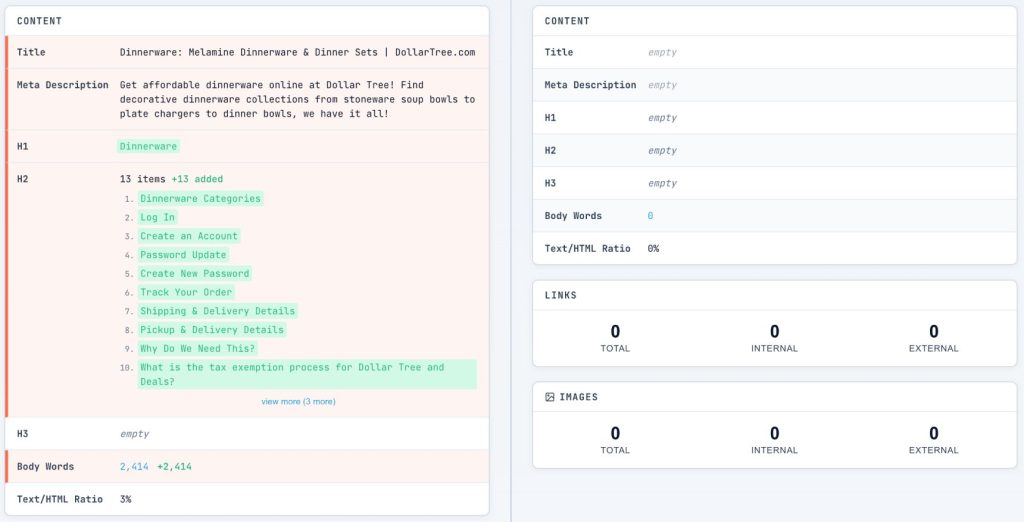
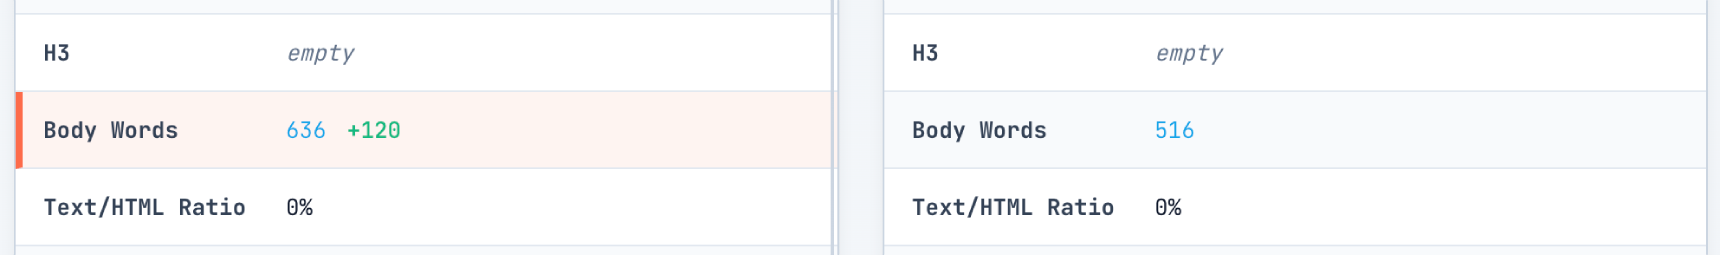
- Word Count Delta: Check the Content Card. If the “Body Words” count drops by >20% when JS is off, you have a dependency. A drop from 1,000 words to 50 means your content is effectively invisible until JavaScript runs.
- Title Drift: Look at the Content Card‘s Title row. Does it match in both columns? If the raw HTML title is “React App” or “Loading…”, that’s what users will see in search results if rendering times out.
- Meta Description: Check the Content Card‘s Meta Description row. It must be present in the raw HTML column. If it’s missing, you lose control over your search snippets.
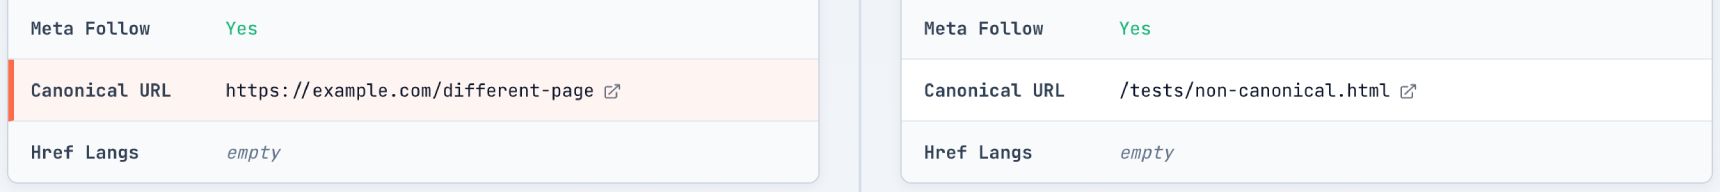
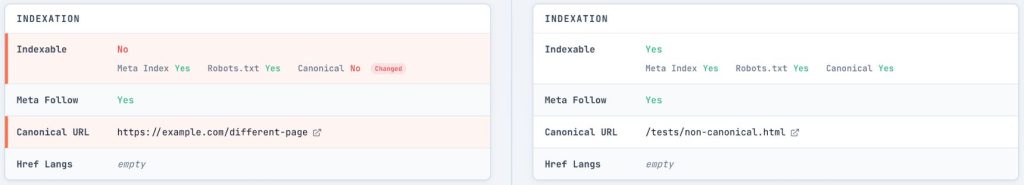
- Canonical Stability: In the Indexation Card, check the Canonical URL. It must be present and correct in the raw HTML. If it’s missing or different, you risk duplicate content issues or Google ignoring your signals entirely.
If the meta robots tag or canonical relies on JavaScript to appear, you are betting your entire indexing strategy on the renderer working perfectly 100% of the time. Don’t take that bet.
Phase 3: Deep Dive – Content Analysis
Now we get granular. It’s not just about how much content is missing, but which content.
The Word Diff Analysis:
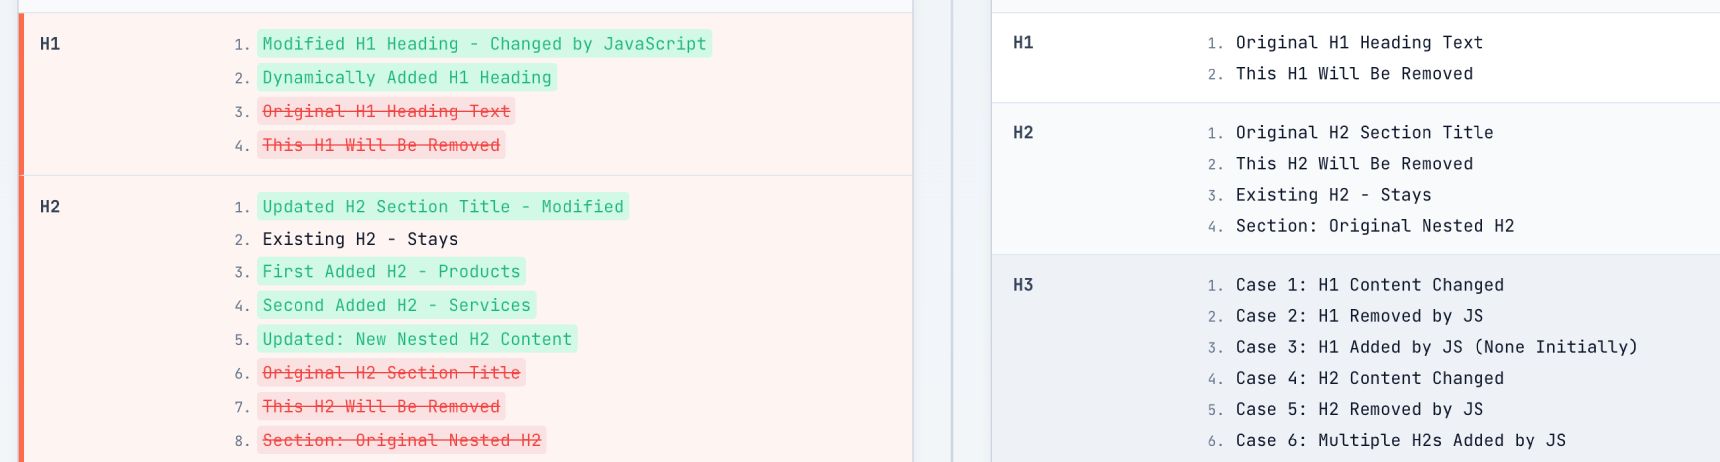
On the Content Card, click the number in the “Body Words” row to open the Word Diff Modal.
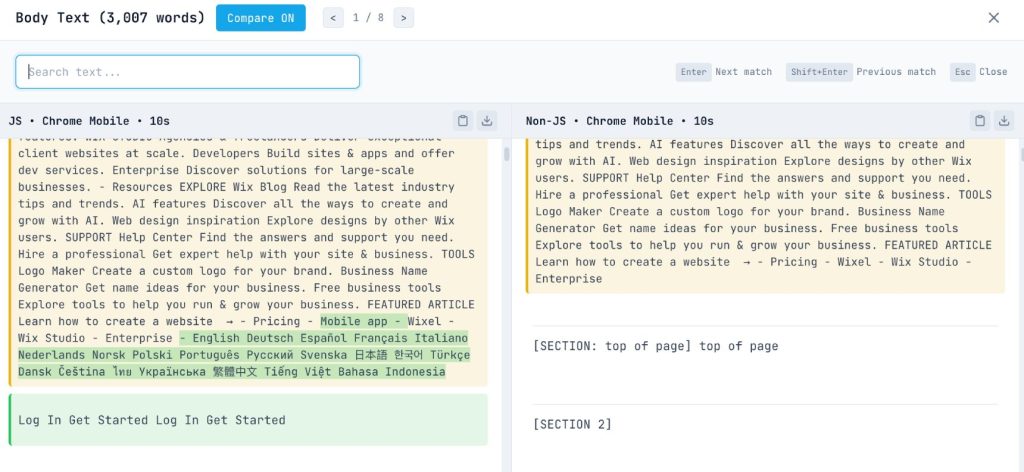
This visualization is powerful. It highlights exactly which words are added by JavaScript (green) and which are removed (red).
- Is the main article text green? That’s a critical issue.
- Are the product specs green? High severity.
- Is it just the “Related Products” widget? Lower severity, but still worth noting.
Heading Hierarchy:
Back on the Content Card, look at your H1s and H2s. Expand them to see the text.
- Missing H1: If the H1 count is 0 in the “Without JS” column, your page lacks a primary topic signal until rendering finishes.
- Header Injection: We often see SPAs where the H1 is populated via an API call. If that call fails or hangs, the page has no title.
Severity Check:
Calculate your dependency:
JS Dependency = (Rendered Words – Raw Words) / Rendered Words
If the result is >50%, mark this as High Severity. You are taxing the search engine’s rendering queue, and for AI crawlers like ClaudeBot or GPTBot (which often don’t run JS), your page is essentially blank.
Phase 4: Technical SEO Checks
Content is king, but metadata is the crown. If the technical signals are wrong, the content doesn’t matter.
Metadata Validation:
Check the Indexation Card and Technical Card.
- Meta Robots: Ensure there’s no accidental
noindextag in the raw HTML that gets removed by JS. Googlebot might see thenoindexin the initial fetch and leave before it ever runs the JS that removes it. - Status Codes: This is subtle. SPAs often serve a
200 OKfor a “Page Not Found” view. Check the Technical Card status code. If a non-existent product returns a 200, you have a soft 404 problem. - Canonical Parameters: Watch for session IDs or tracking parameters (e.g.,
?utm_source=...) in the raw HTML canonical tag that JS later removes. Google may index the messy version first.
Structured Data (JSON-LD):
Look at the Content Card‘s “Schema” row.

Does your Product, Article, or BreadcrumbList schema appear in the “With JS” column but not “Without JS”?
Google can render structured data, but it’s fragile, and AI crawlers like ClaudeBot often miss it entirely. If the script takes too long or the crawler doesn’t execute JS, you lose your Rich Snippets and answer engine citations. Best practice: put JSON-LD in the initial HTML.
Phase 5: Links & Images Audit
This is where the crawl budget goes to die.
Link Discovery:
Open the Links Modal from the Links Card. Filter by “Internal” and switch the view to “Added” (links only found after JS).
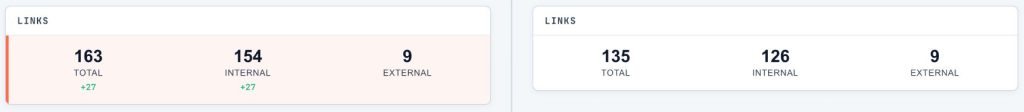
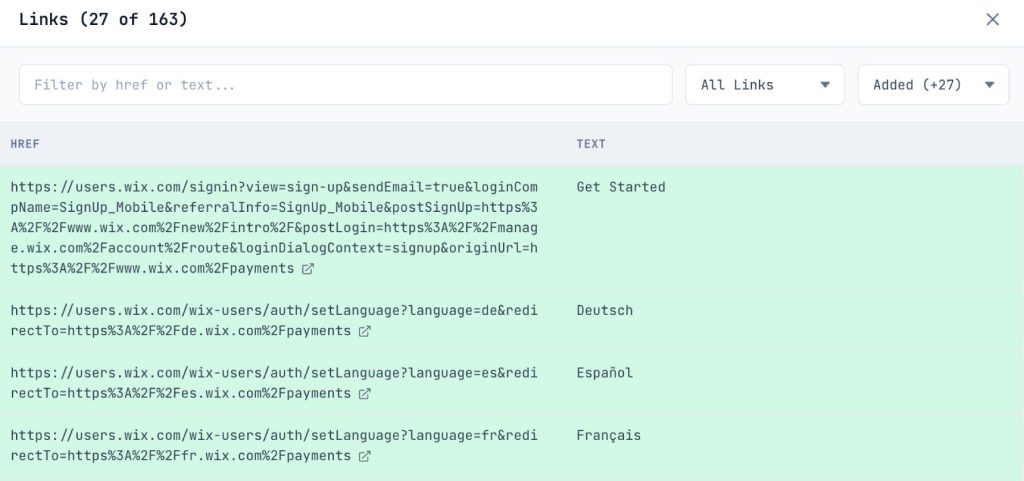
- Navigation Links: If your main menu or footer links are in this list, search engines can’t discover the rest of your site without rendering. This causes massive crawl inefficiencies.
- Pagination & Related Products: Watch for “Load More” buttons or “You May Also Like” sections. If these links only appear after JS execution, deep pages and cross-linked products become orphaned.
- Missing Links (The onClick Trap): Scan the list. Are all your critical navigation links present? If you see fewer links than expected, you might be using
onClickhandlers on<div>or<button>elements instead of real<a href>tags. Since crawlers (and our auditor) only look forhrefattributes, these “fake” links won’t appear in this list at all, making them invisible to search engines.
Image Visibility:
Open the Images Modal from the Images Card.
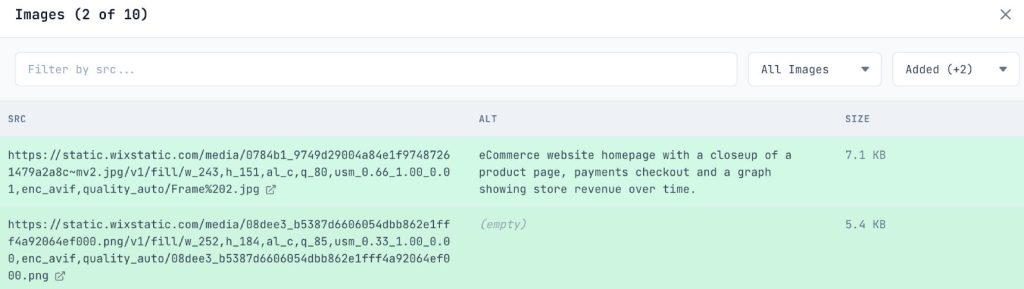
- Lazy Loading Fallbacks: Look for images that exist in “With JS” but not “Without JS”. If you’re using a JS-based lazy loader without a
<noscript>fallback or nativeloading="lazy", Googlebot’s initial pass sees no images. - Alt Text: Check if the
alttext is populated in the raw HTML. If it’s injected later, you’re hurting accessibility and Image Search ranking.
Phase 6: JavaScript Debugging
Why is the rendering failing? The Result Tabs at the bottom of the panel hold the answers.
Console Errors:
Switch to the Console Tab.
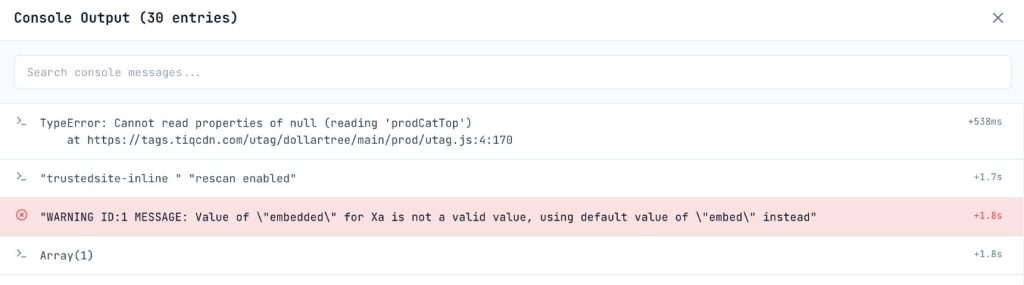
- Red is Dead: Any
TypeErrororReferenceErrorhere is a smoking gun. If a script crashes during rendering, Googlebot sees a broken page. - CORS Errors: Look for cross-origin request failures. If your JS tries to fetch data from a domain that doesn’t allow the auditor’s origin, content will fail to load, mimicking a crawler’s struggle with strict security headers.
- Hydration Errors: Look for React/Vue hydration mismatch warnings. These force the browser to throw away the server-rendered HTML and re-paint, causing layout shifts (CLS) and potential indexing glitches.
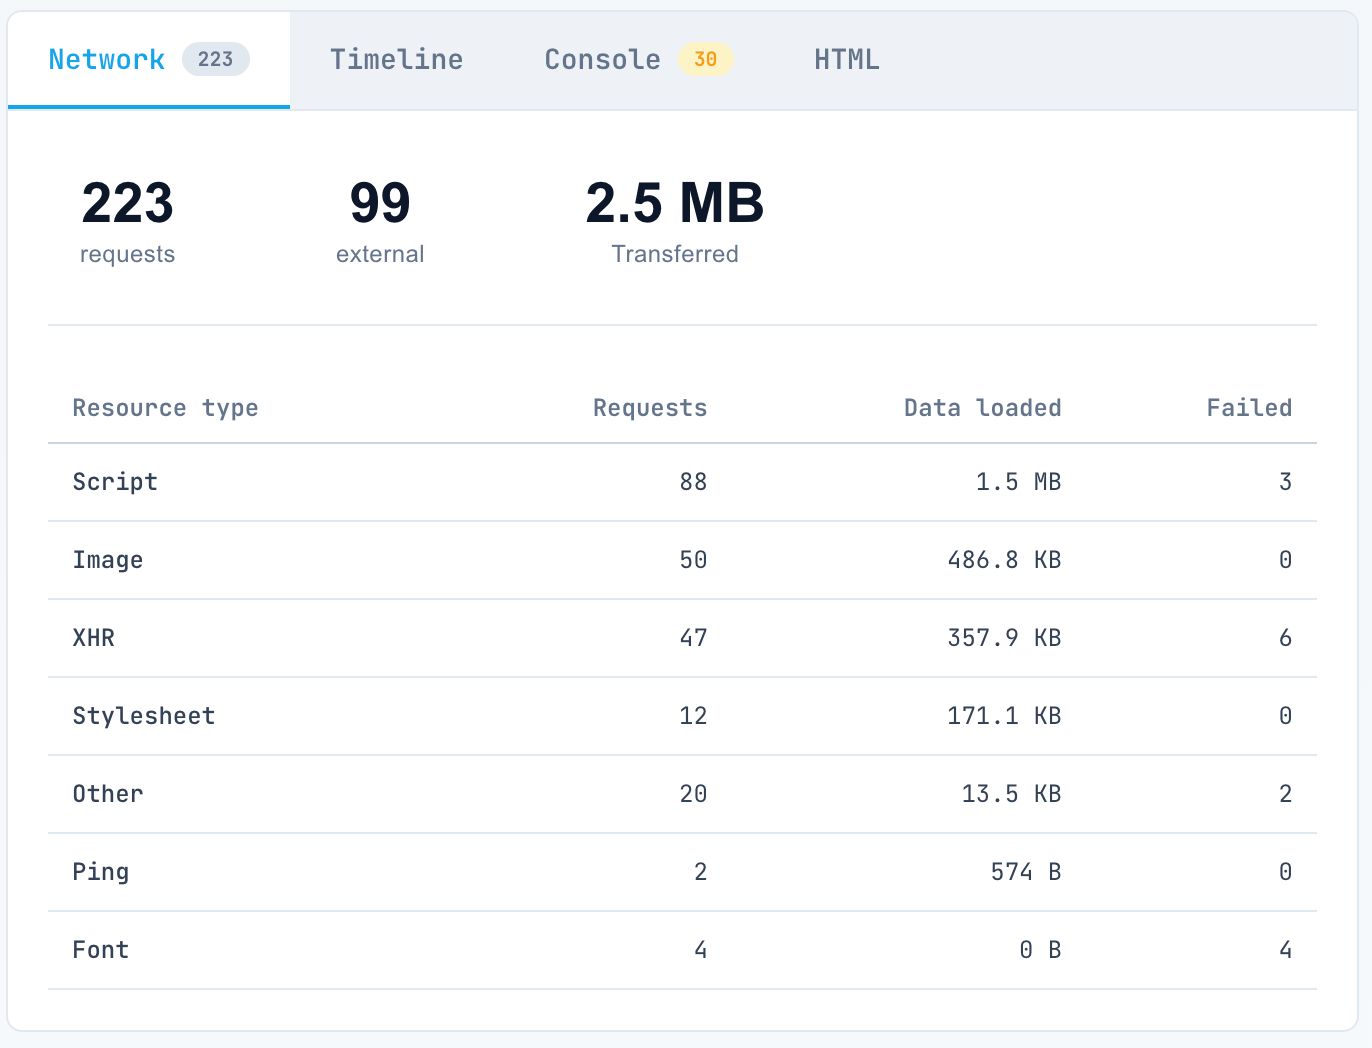
Network Performance:
Switch to the Timeline Tab and Network Tab.
Watch for two key events:
- DOMContentLoaded: When the initial HTML is parsed.
- load: When all resources (images, scripts) have finished.
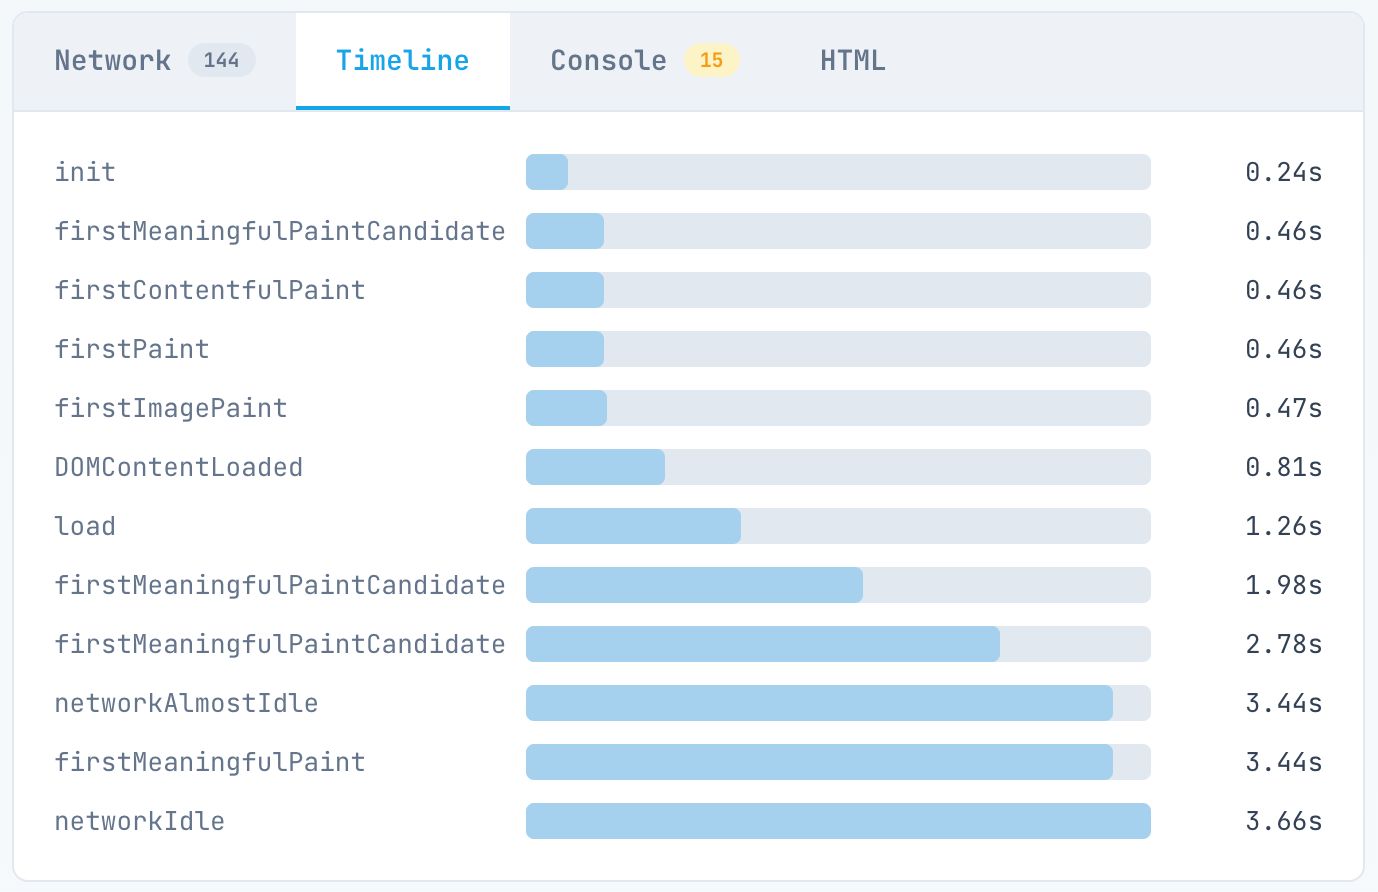
- The 5-Second Rule: Googlebot doesn’t have infinite patience. If your “load” event or main content paint takes >5 seconds on the timeline, you are in the danger zone.
- The Stale Cache Trap: Google caches JS files aggressively (up to 30 days) and often ignores cache headers. If you see random rendering failures after a deployment, Google might be trying to run an old, cached script against new HTML. Ensure your file names change with every deploy (e.g.,
main.a1b2.js). - Blocked Resources: Check for
403or404errors on JS bundles. Sometimes a firewall orrobots.txtrule accidentally blocks the very script needed to render the content.
Phase 7: User Agent Testing
You’ve tested “With JS” vs. “Without JS”. Now test who is asking.
From our experience, bugs or developer misunderstandings often lead to a dangerous discrepancy: a site may serve full SSR content to human users but an empty CSR shell to Googlebot (or vice-versa) due to misconfigured bot-detection or edge-caching rules. User agent testing is the only way to verify that your content delivery remains consistent and that you aren’t accidentally “hiding” your SSR benefits from the very crawlers that need them most.
In the Config Modal, change your User Agent.
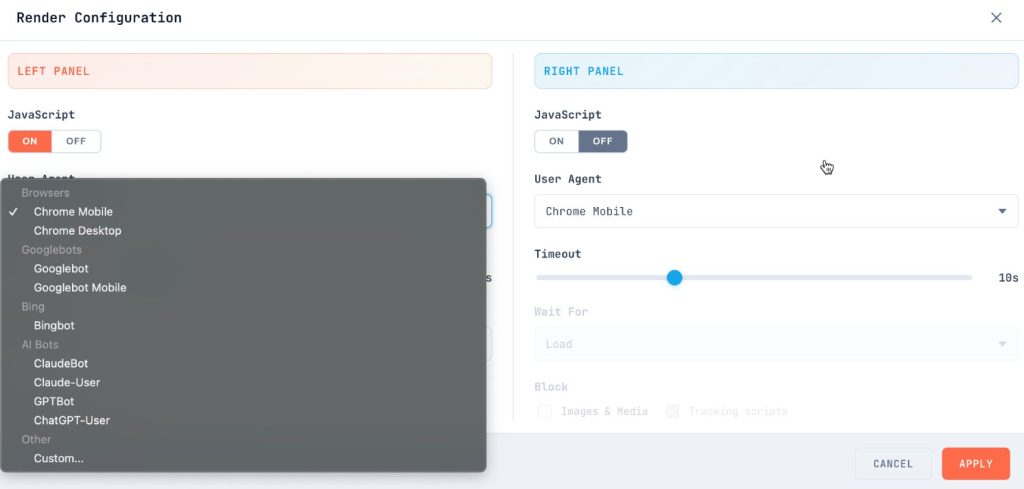
Googlebot (Smartphone):
This is how Google actually indexes the web.
- Does the mobile view hide content that was visible on desktop?
- Do the heavy scripts cause timeouts on a slower mobile profile?
ClaudeBot / GPTBot:
Set the User Agent to a custom string like ClaudeBot/1.0.
- AI crawlers do not execute JavaScript.
- Does your page look like the “Without JS” view? If so, your content is invisible to current-generation AI answer engines. If you want to be cited in ChatGPT, you need server-side rendered text.
Phase 8: Reporting & Prioritization
You have your data. Now you need to fix it. Group your findings by severity:
Critical (Fix Immediately):
- Main content blank without JS.
- Canonical tag missing or incorrect in raw HTML.
noindexin raw HTML (even if removed by JS).- Console errors crashing the render.
High (Fix Next Sprint):
- Primary navigation links only visible after JS.
- >50% of text content relies on client-side fetching.
- Page load time >5 seconds.
Medium (Roadmap):
- Structured data injected via JS.
- Lazy-loaded images missing
noscriptfallback. - Meta descriptions generated client-side.
Low (Best Practice):
- Minor word count variations.
- Non-critical widget content is loading late.
The Goal: Resilience
The web is moving toward more interactivity, not less. But the mechanism for discovery, the crawler is still fundamentally an HTML-parsing engine.
By auditing your site with this workflow, you aren’t just “fixing SEO.” You’re building resilience. You’re ensuring that no matter how complex your application becomes, the fundamental bridge between your content and your users remains intact.
If maintaining that bridge feels like a distraction from building your product, consider EdgeComet. We open-sourced our rendering-cache engine to help teams solve these discovery problems at the infrastructure layer, so you don’t have to fight the rendering gap manually.