

Custom SEO alerts built from your site's own data
The EdgeComet site analysis drafts the alerts your site should have from its own data: 30 days of bot traffic, the latest crawl, your page groups (saved segments) and Search Console. Also called the alerts site audit or custom alerts.
Each draft gets a threshold set from your numbers and is replayed against the site's recent history. In the card's words, it "fires on real breakage and stays quiet on the site's normal ups and downs."
The drafts turn on by themselves 7 days after the analysis, unless you keep them off.
How the site analysis works
The site analysis is an AI agent. It works through your site's numbers in four steps:
- It reads your site. Bot traffic per day, the normal level of origin errors in each check, the bot mix, Search Console clicks over the last 4 weeks, your page groups, the latest crawl and its issues, your custom extraction fields and the alerts you already have.
- It drafts alerts. Availability comes first, with thresholds above the busiest normal check. Then alerts scoped to your page groups, such as noindex on product pages or a lost home page, and crawl issues that are present or growing. It can also propose changes to alerts you have that fire too often or skip most checks.
- It tests each draft. Every draft runs against your current data and, where the history exists, is replayed over the site's recent past to count how many alerts it would have raised. A warning or critical draft that would have fired too often is withdrawn or tightened.
- It explains itself. Standard alerts it chose not to draft are listed under Left out on purpose, each with the reason in your own numbers. Problems that are already true today are listed as findings, because they need a fix, not an alert.
The analysis keeps the set small. It never deletes an alert you have.
When the analysis runs
The analysis runs once on its own when a site has enough data, and again whenever you start it:
- Automatically: once per site, after 7 days of verified bot traffic and at least 300 distinct pages served to bots in the last 30 days. It runs in the daily pass at 06:30 UTC.
- On demand: press Analyze my site on the card or in the Alerts header. It takes a few minutes, and you can follow it with Watch it work.
- Again: press Analyze my site in the Alerts header after a redesign, a migration or new page groups. While an analysis waits for review, the button reads Analyze again, and the new analysis replaces the one waiting for review.
Until the first analysis, a site with no alerts, or whose alerts have not run a check yet, shows the Custom alerts for {domain} card on the Alerts page.
The card lays out the plan in three steps: turn on the recommended alerts now (or "Your alerts are on" when they already run), let EdgeComet study the site, and get the custom alerts a week after the drafts. While the site is still collecting data, the second step counts the days of verified bot traffic.
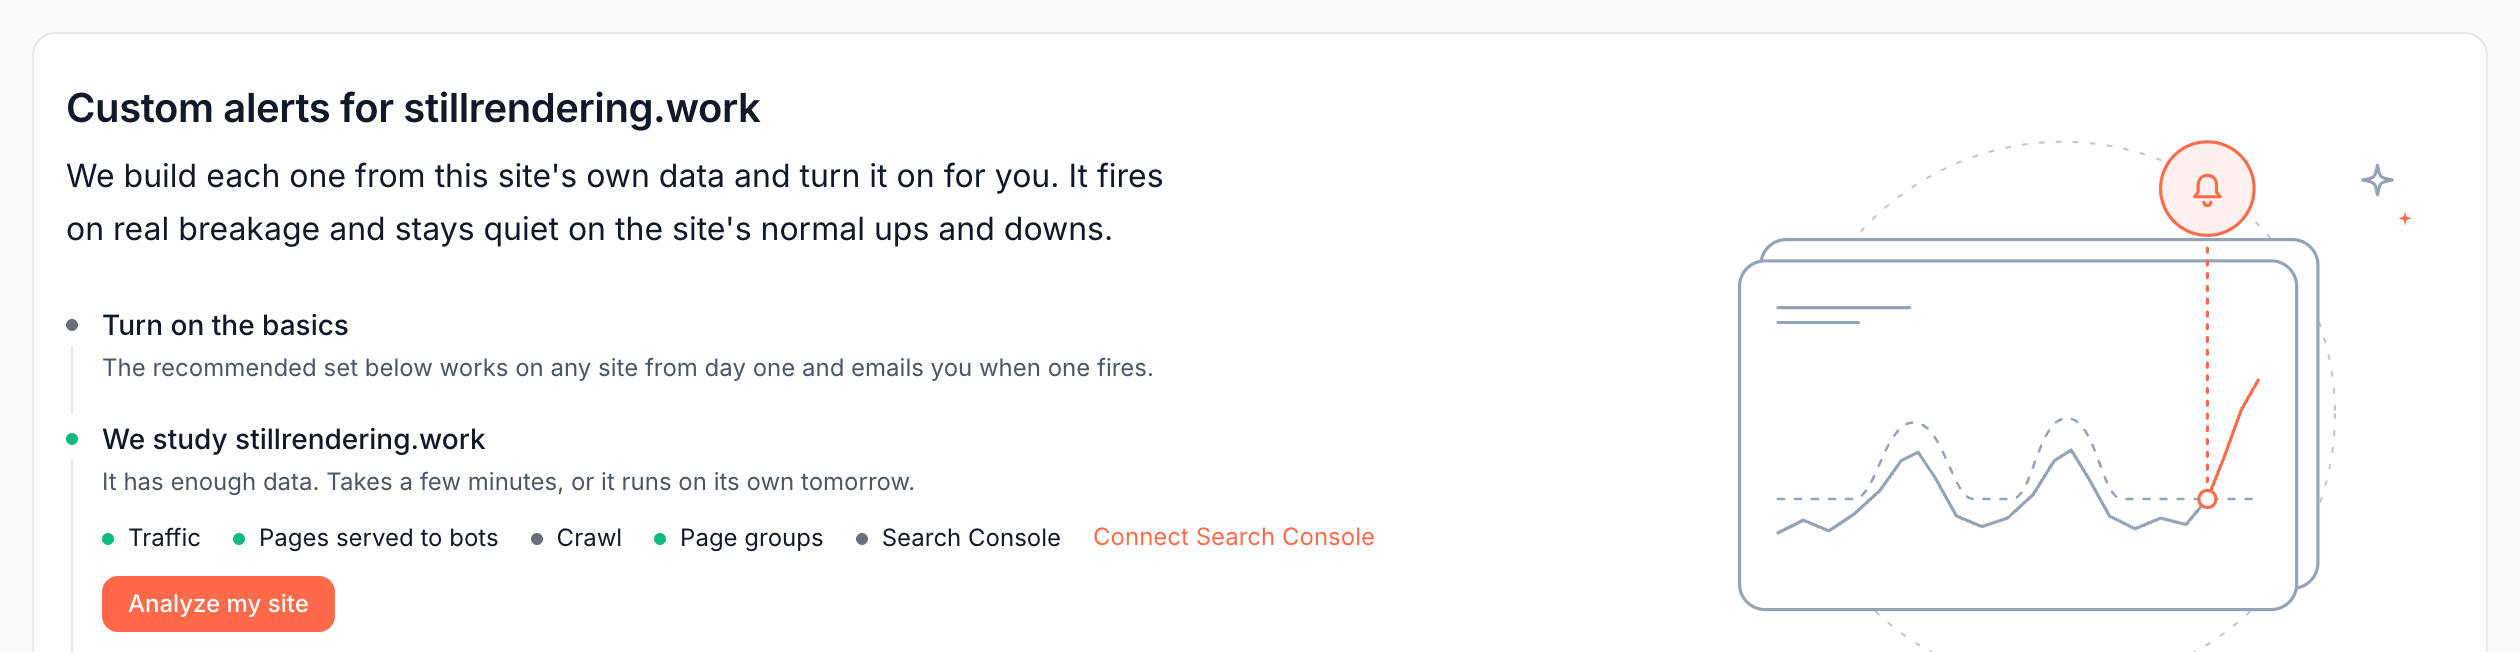
The recommended alerts you turn on keep running after the custom alerts arrive. See Turn on the recommended alerts.
Review the drafts
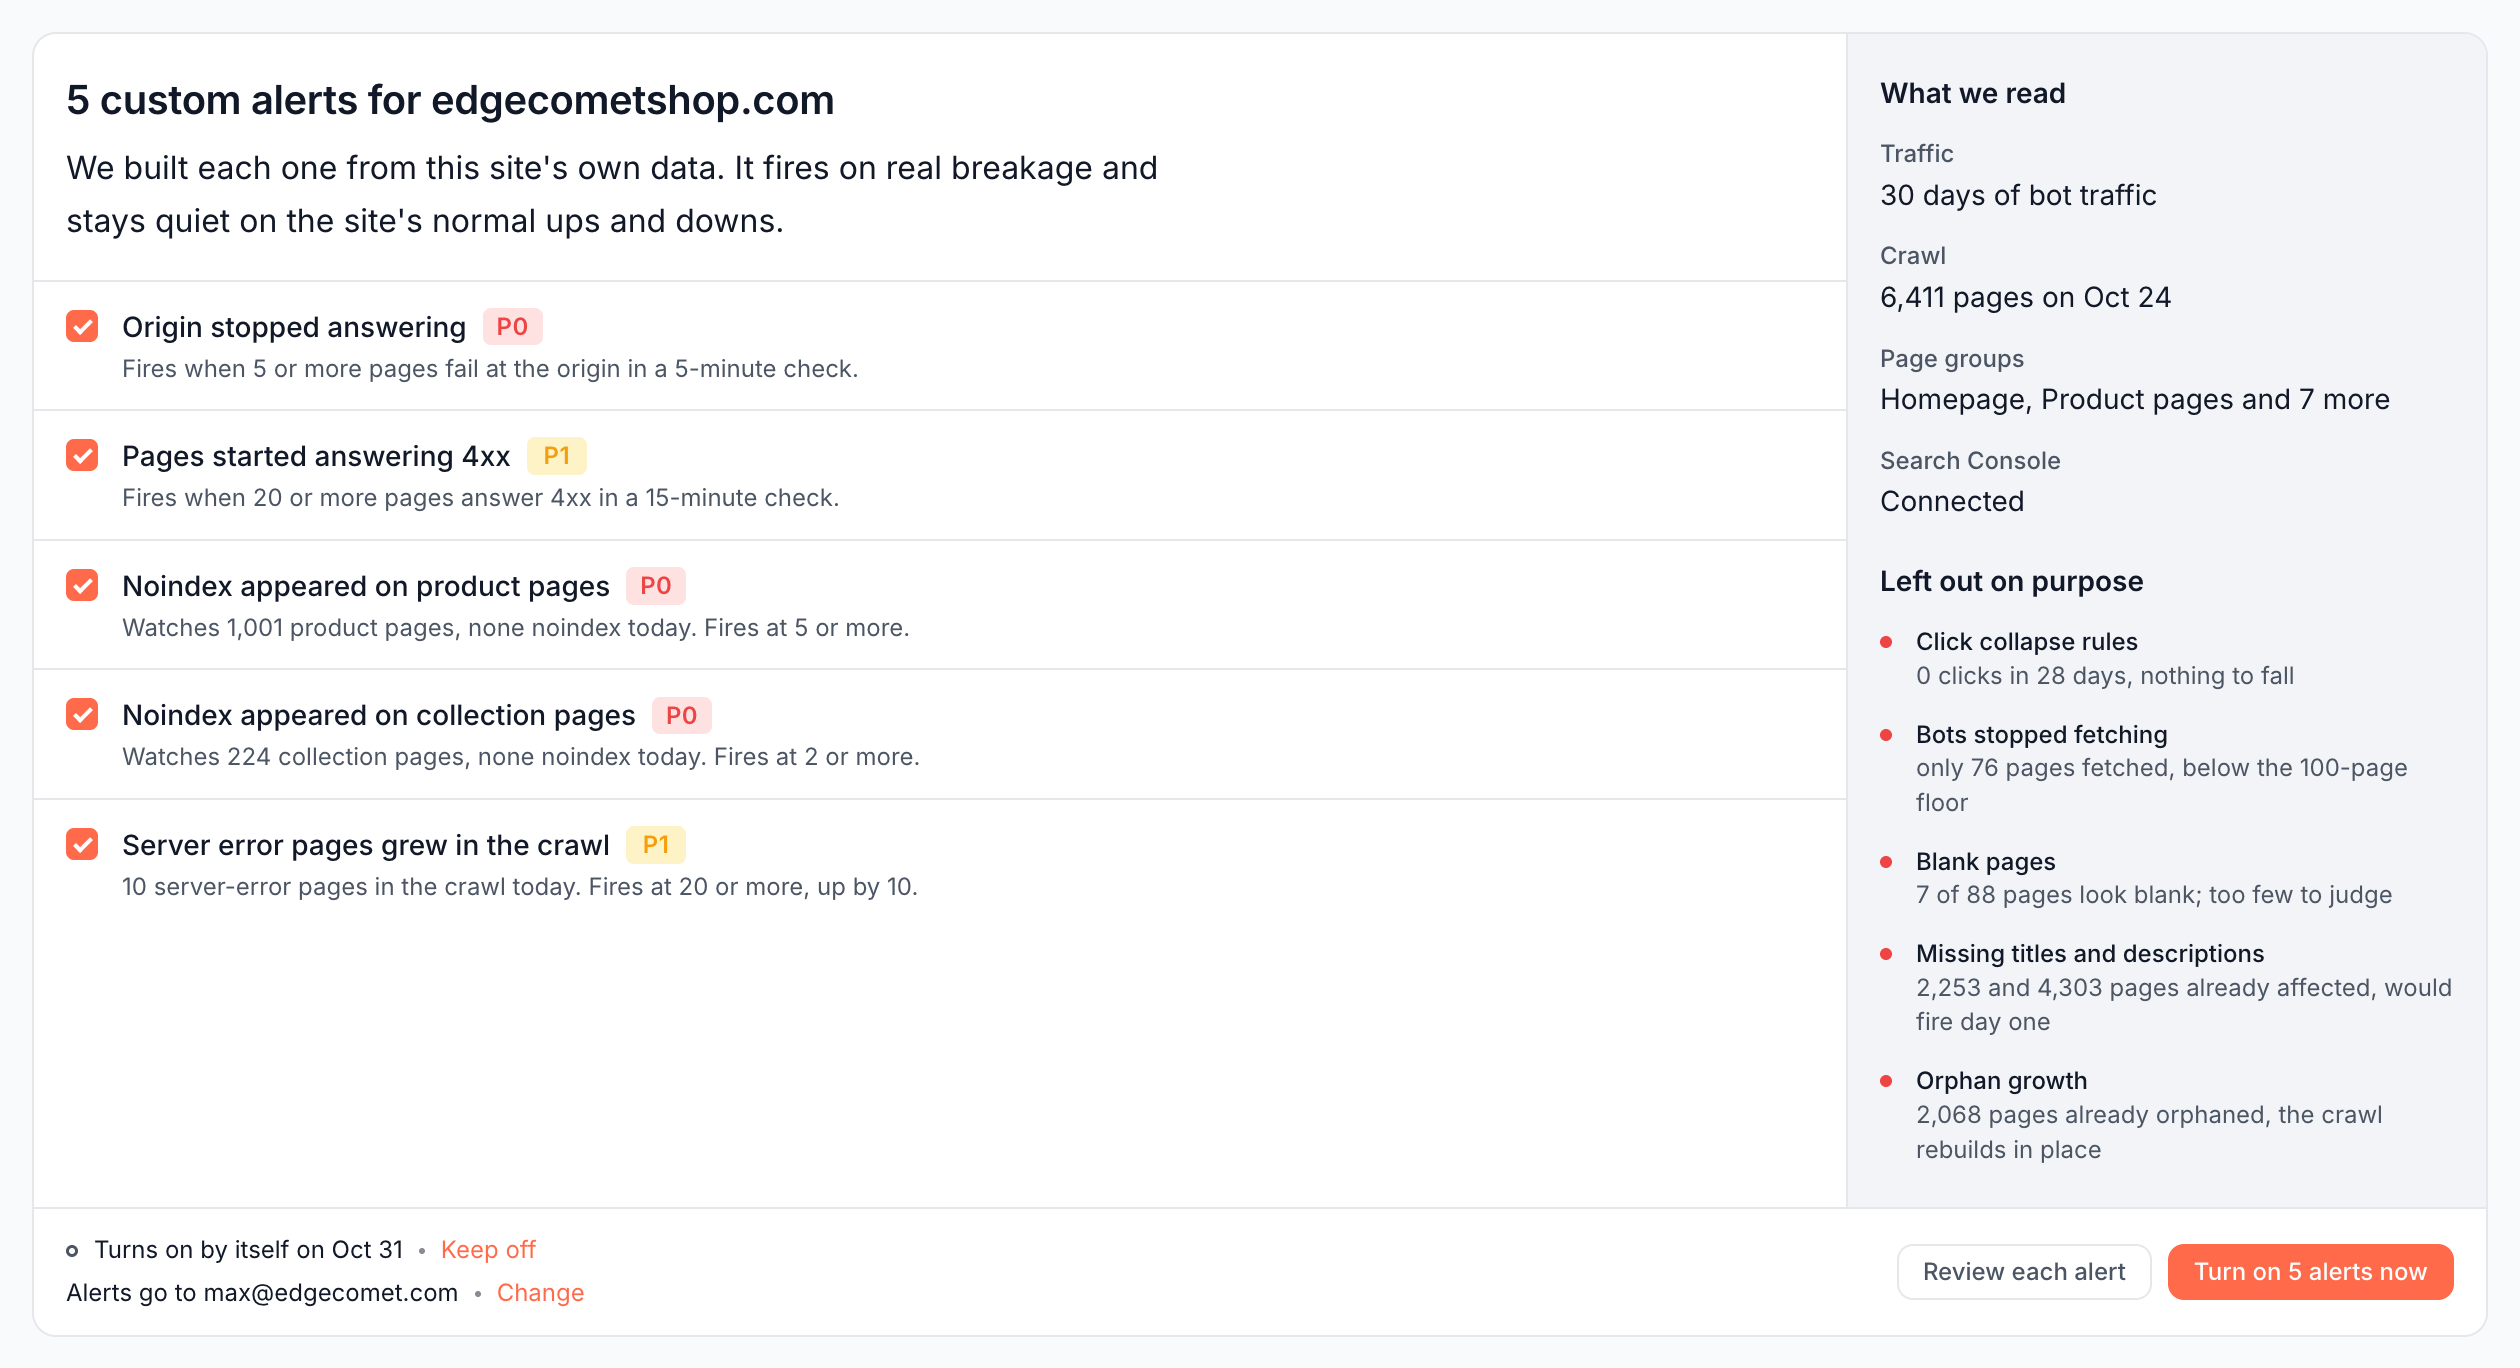
When the analysis finishes, the card on the Alerts page lists the drafts, all ticked: name, severity and one line on what each watches and when it fires. A draft that changes an alert you have says Changes your rule: and its name.
Next to the drafts, the card shows:
- What we read: the traffic, crawl, page groups and Search Console data the analysis used.
- Left out on purpose: up to five standard alerts it chose not to draft, such as "Bots stopped fetching: only 76 pages fetched, below the 100-page floor".
Untick a draft to leave it out. You get an email when the drafts are ready. See The email when drafts are ready.
Review each alert
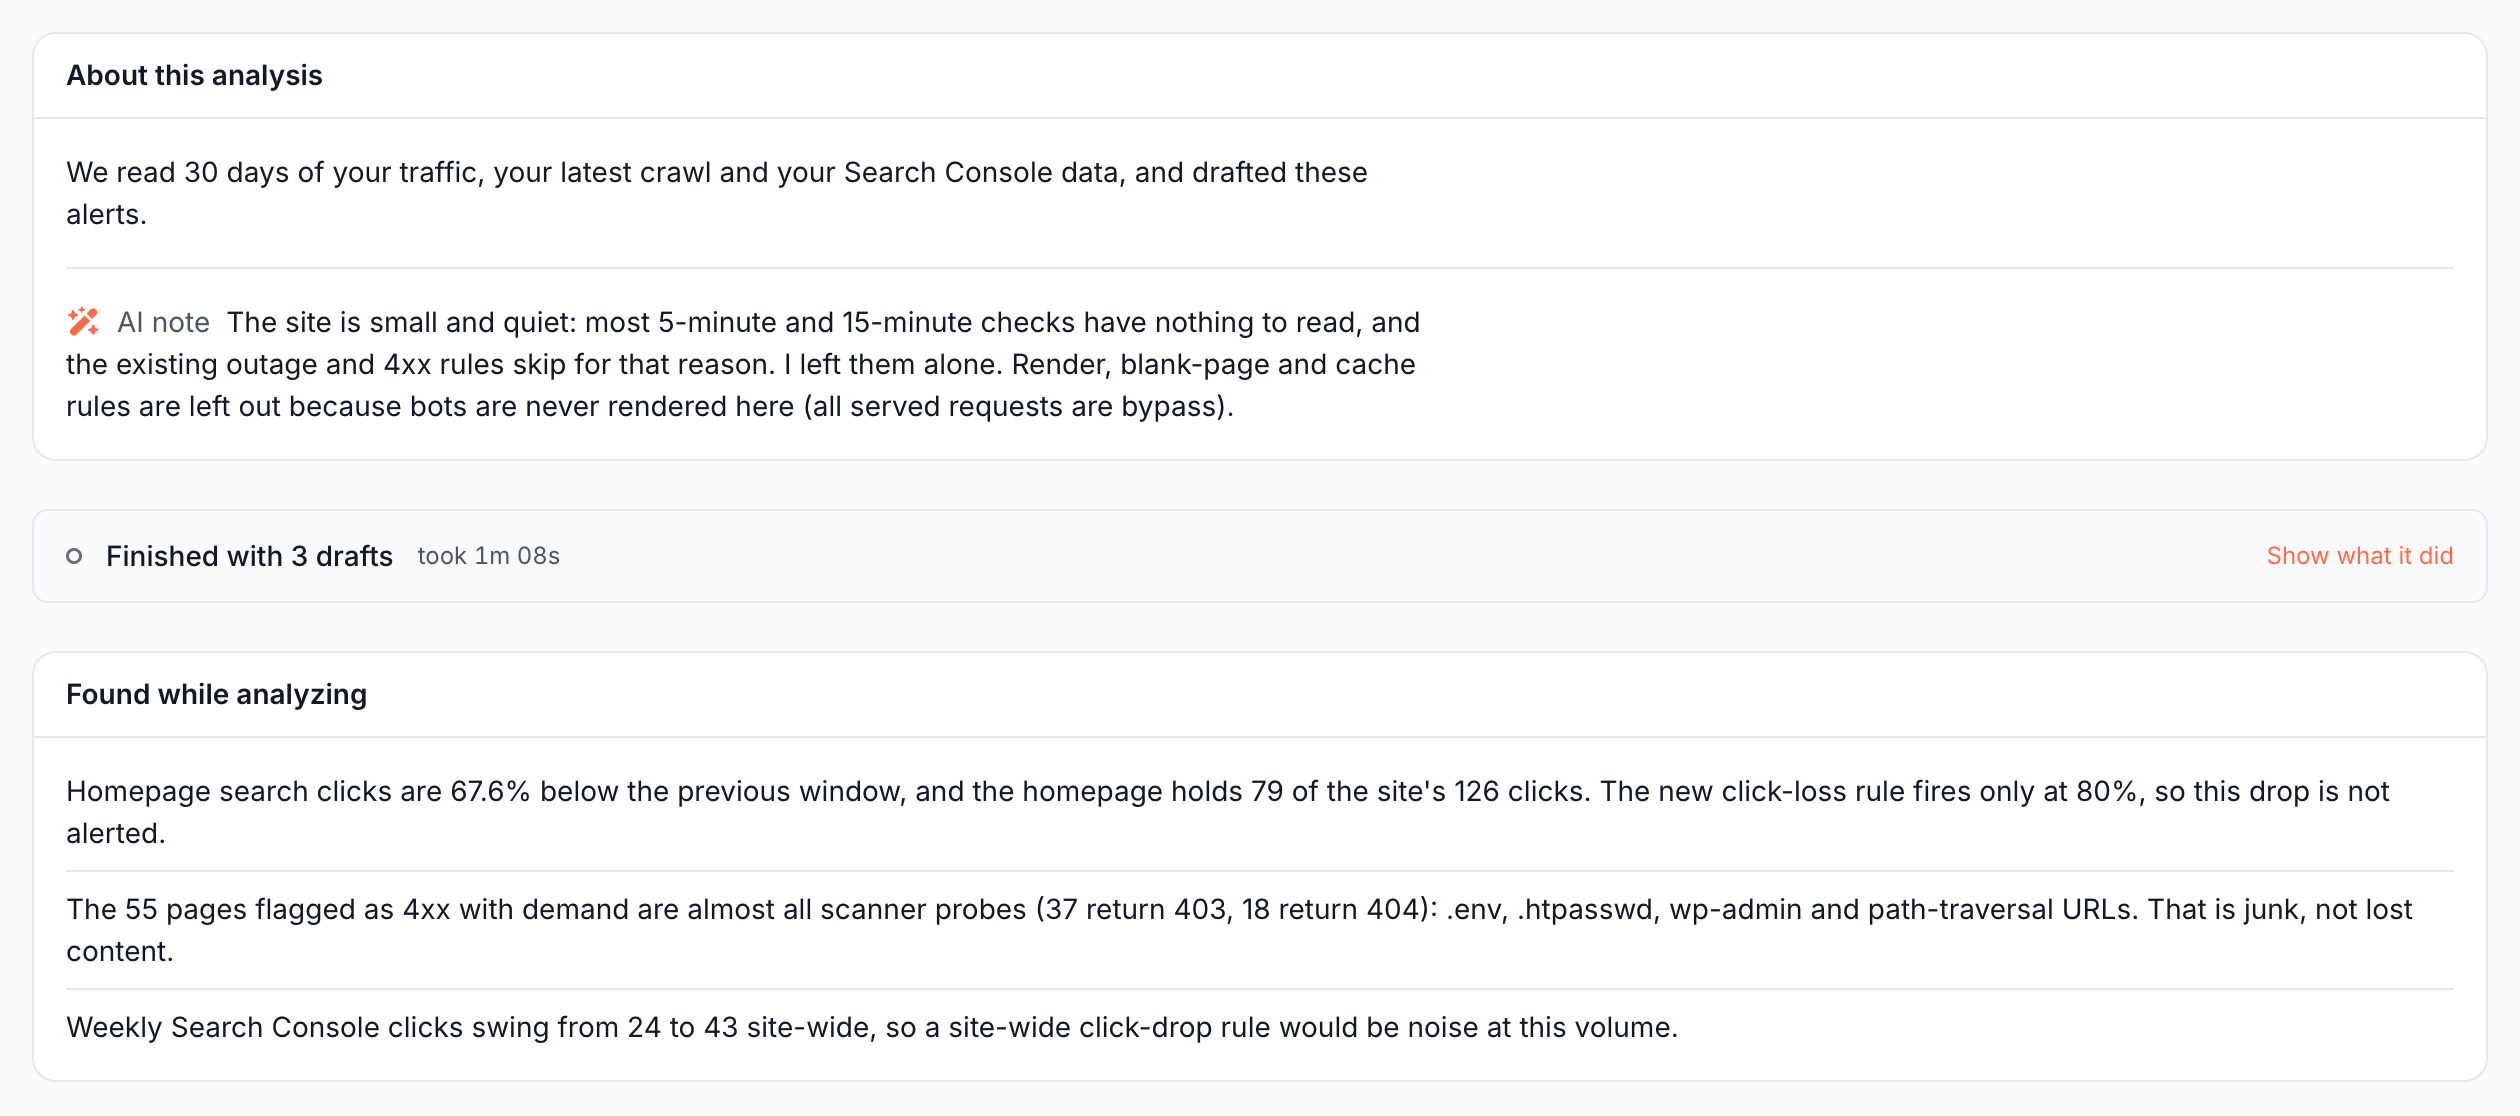
Review each alert opens the Site analysis page. It starts with what the analysis read, its own note on the site, and Found while analyzing: problems already true today that are worth fixing rather than alerting on.
Each draft then has its own card:
- Watches and Pages: what it counts and on which pages. Change edits the pages.
- Fires when: the condition, what the latest window shows, and how often it would have fired, such as "Last 30 days: would not have fired."
- Checked: how often it runs.
- Why: the analysis in its own words, with the numbers behind the threshold.
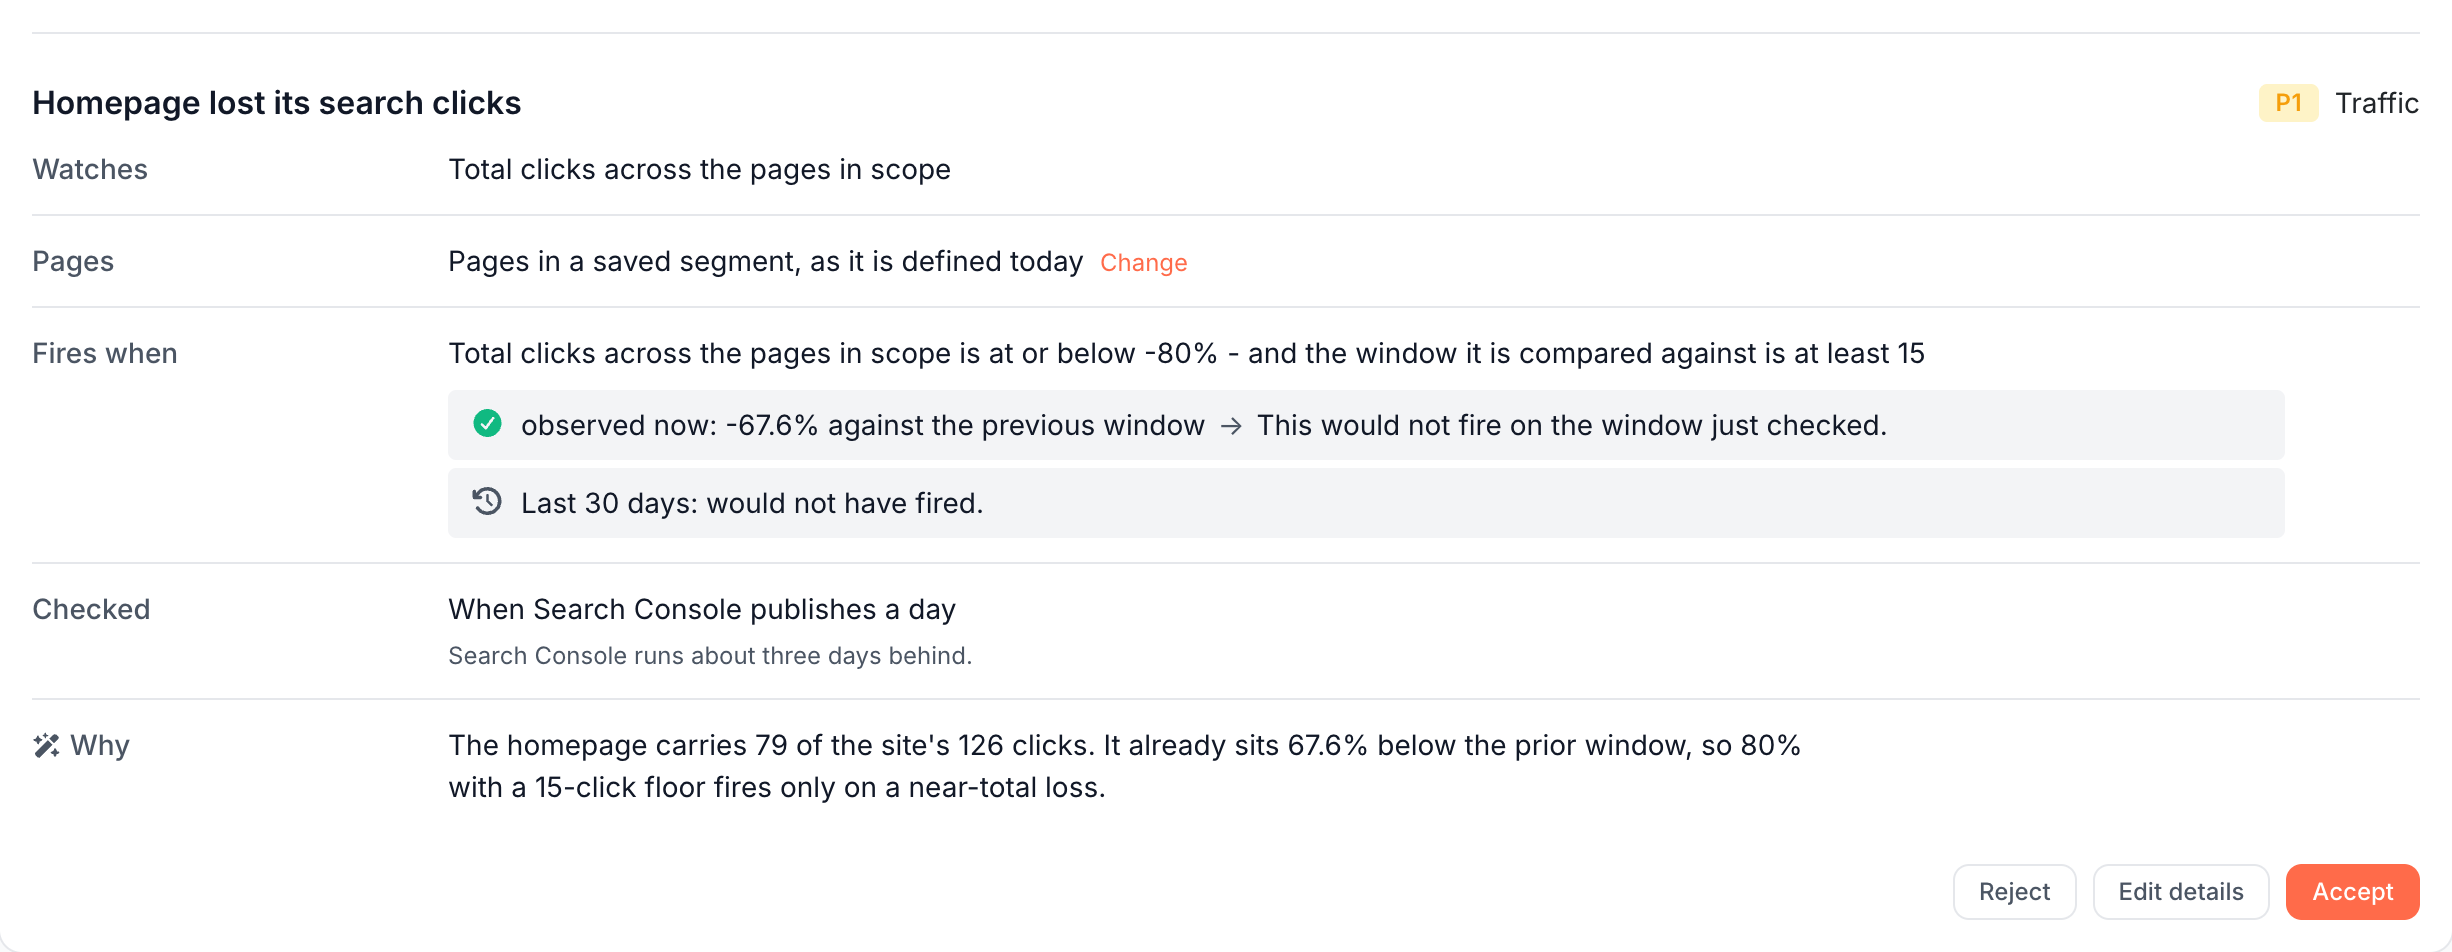
Edit details changes the name, severity, pages and threshold of a draft. To change anything else, ask in the chat beside the page. See Change drafts in the chat.
Turn the alerts on, or keep them off
The footer of the card decides when the drafts become alerts:
- Turn on N alerts now: turns on the ticked drafts at once and discards the rest. When drafts change alerts you have, the button reads Apply N changes now.
- Turns on by itself on {date}: 7 days after the analysis finished, at 06:30 UTC, the ticked drafts turn on. With nothing ticked, nothing turns on.
- Keep off: stops the automatic turn-on. The card reads "Kept off. They wait here until you turn them on.", and Undo brings the date back.
The new alerts are ordinary rules, created by EdgeComet AI: you edit, pause or delete them on the Rules page. See Alert rule states: watching, skipped, warming, broken.
The email when drafts are ready
When an analysis has drafts for review, EdgeComet emails the site's alert addresses, whatever their minimum severity, or the owner's account address when the site has none. Nothing is sent while the site's notifications are muted.
The subject reads [EdgeComet] We analyzed {domain} and drafted N alerts. The email gives the date the drafts turn on, lists up to six of them, counts the findings, and links to the review page with Review the drafts.
If it does not work
"Analyze my site" is disabled
Hover the button to see why:
- "Needs 7 days of traffic data - no verified bot has visited yet." or "... N more days.": the analysis waits for a week of verified bot traffic. See Watch for the first verified visit.
- "Needs 300 distinct pages served to bots in 30 days - N so far.": a small or new site needs more pages fetched by bots first.
- "A site analysis is already running.": follow it with Watch it work.
- "Alert drafts are being written for this site. Try again when they are ready.": an alert you asked Ask for is being drafted, and only one drafting run works on a site at a time.
"The analysis stopped before it finished"
The analysis was cut off before it drafted anything it could stand behind, and nothing was written to your alerts. Start it again with Analyze my site.
No drafts to review
When the analysis finds nothing to add or change, no drafts wait for review and no email goes out.
If every draft matches an alert you already have, the card reads "Your alerts already fit {domain}", and nothing turns on.
Where to find it
In the dashboard: Alerts > Alerts, the card at the top of the page, and Analyze my site in the header. The review page opens from Review each alert or from the email.