

Find exposed .env, .git and backup files scanners probe for
Log Analyzer > Security shows which sensitive files scanners request on your site and how your site answers them. EdgeComet flags every probed path that answered with real content, such as an .env file, a .git folder or a debug log. Also called vulnerability scanner traffic or path probing.
The scanners EdgeComet sees send a bot user agent, often posing as Googlebot, GPTBot or another known bot. EdgeComet records each request as it serves it. The page works from that live traffic, with no log files and no scan of your own.
A 404 is the healthy answer. A 200 that carries the file is a leak, and the page lists it first.
What the report shows
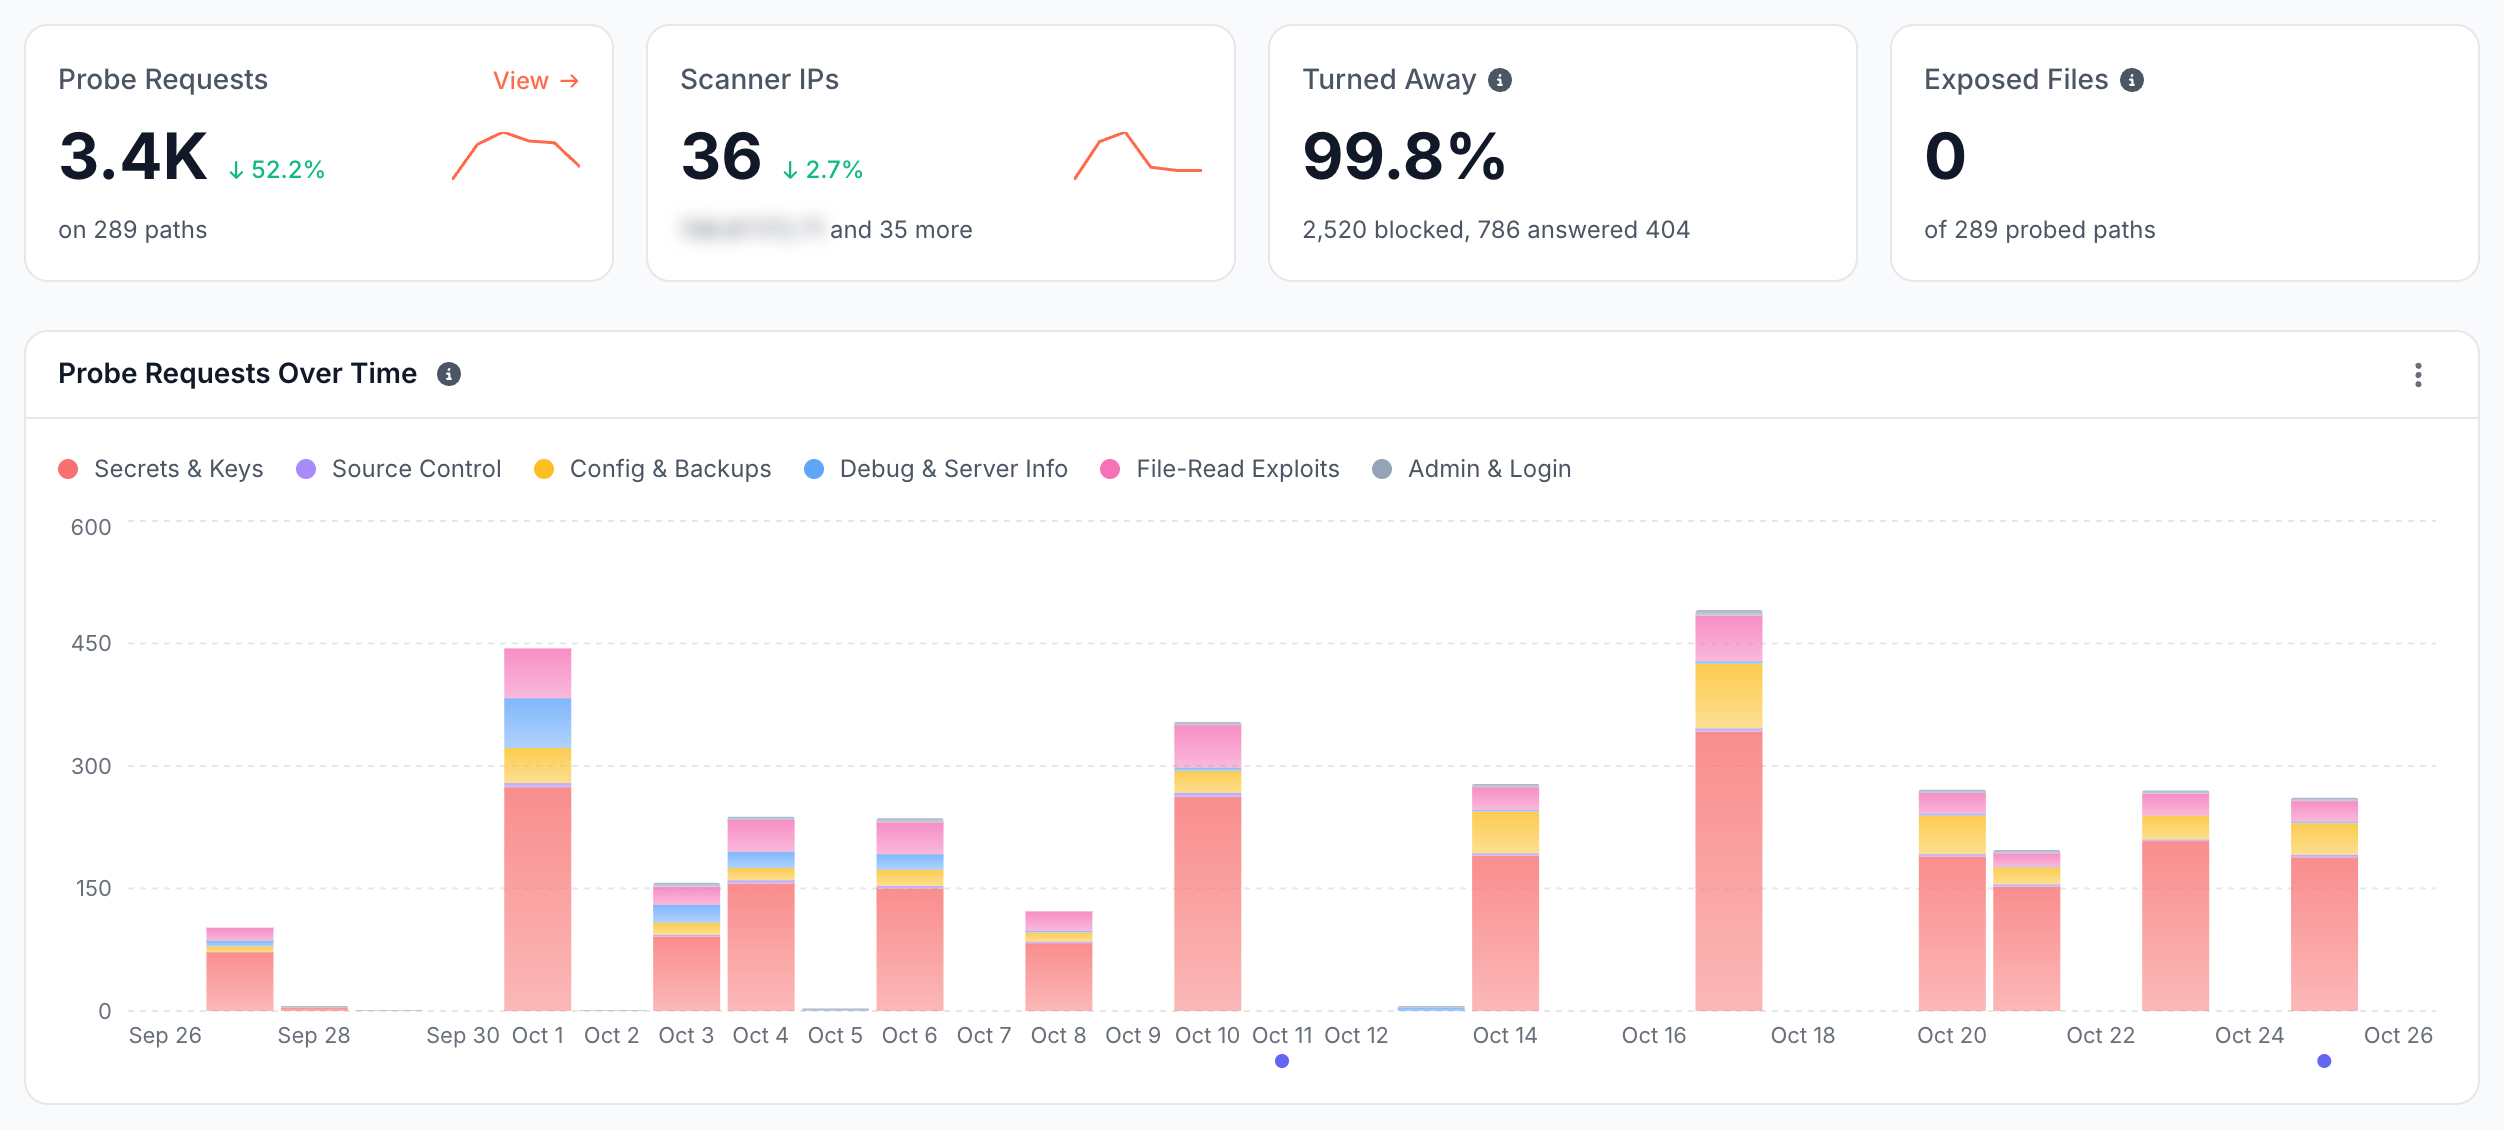
The Security page counts the period's probe requests, lists any exposed file, splits probes by outcome and category, and lists the paths and IPs behind them. It has a period and no segment filter.
What is a probe request?
A probe request is a request for a path on EdgeComet's list of paths scanners use to find files and endpoints that must never be public. The list covers seven categories. EdgeComet matches the path in lowercase and decoded, so /admin%2f.env counts as /admin/.env, and a trailing slash makes no difference.
A request for any other path is also a probe request when its query string carries a scanner payload, such as /userfiles?path=../../.env or /index.php?-d+allow_url_include=1.
The page counts probe requests from every bot except verified search and AI bots, because a verified crawler that fetches such a path usually follows a link on your site. Requests that fail IP verification stay in: scanners fake bot identities. Pre-cache requests are not counted.
A probe request is not the same as a fan-out probe, which is a search keyword.
How many probes reach your site?
| Card | What it shows |
|---|---|
| Probe Requests | Probe requests in the period, with the change from the previous period. The footer counts the distinct paths, and View opens the requests in Data Explorer |
| Scanner IPs | Distinct IP addresses that sent probe requests, with the change. The footer names the IP that sent the most |
| Turned Away | The share of probe requests answered 404, 410, another 4xx or a redirect. It never rounds up to 100% while a probe got through |
| Exposed Files | Probed paths that answered with content. The value turns red above zero, and the footer dates the oldest exposure |
The Turned Away footer names its two largest outcomes, such as "2,520 blocked, 786 answered 404". Under 90%, it names the largest outcome that got through instead, such as "4,788 got the same page".
Which files are exposed?
An exposed file is a probed path that answered 200 with content in the period, other than your site's catch-all page, a login page or an image. Exposed Files lists each one, most serious first, and appears above the charts only when at least one path is exposed.
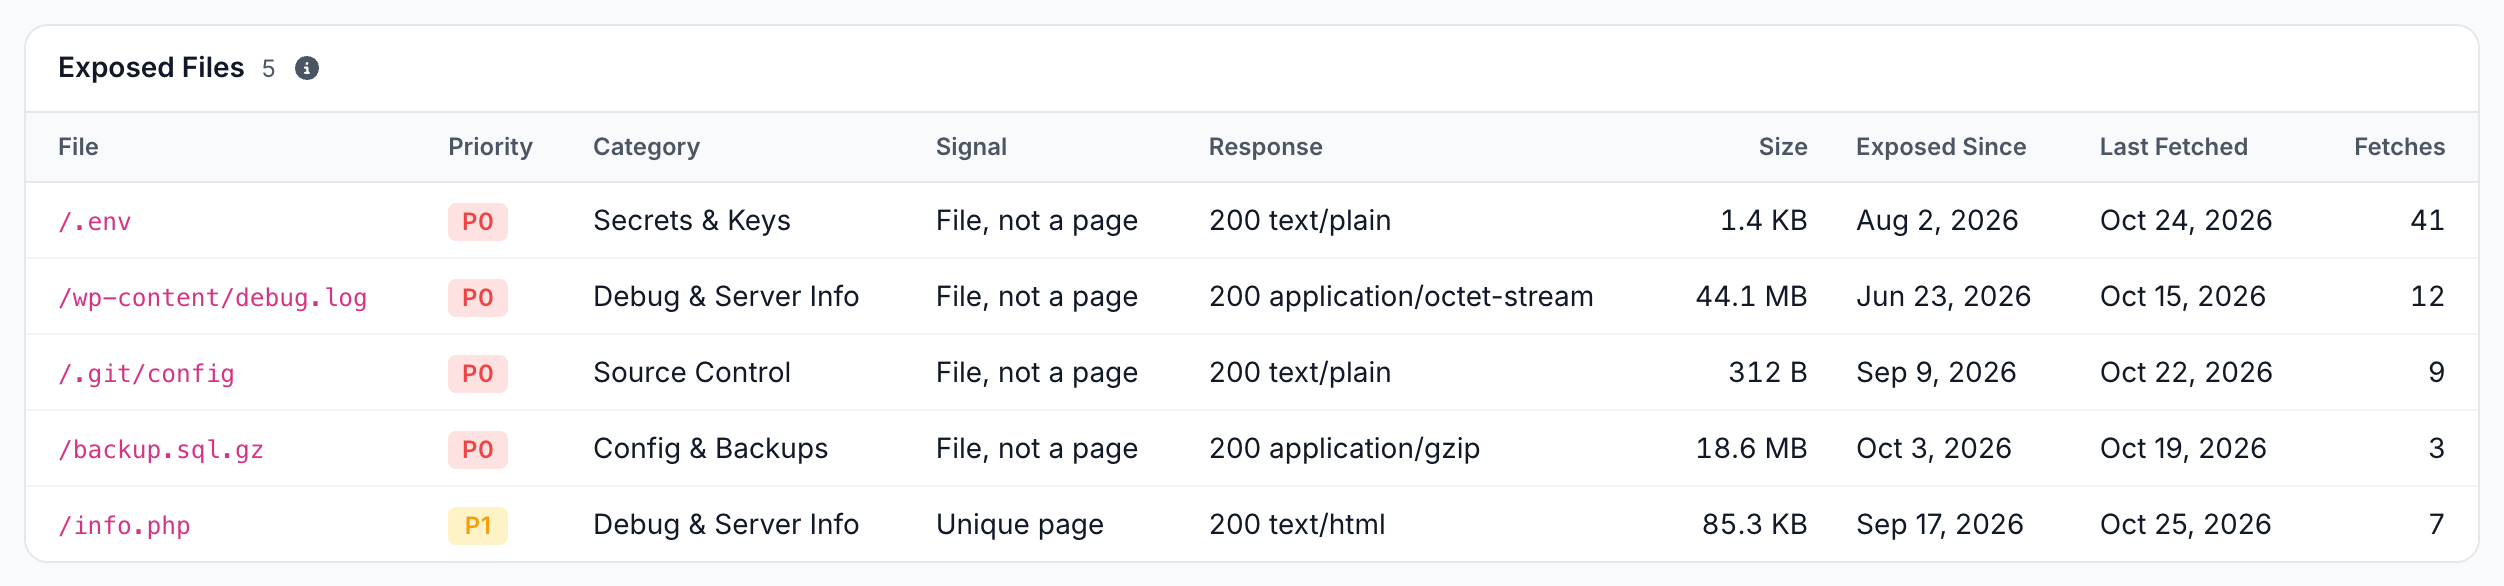
- Priority: P0 "Can leak credentials or data" for secrets and keys, source control, config and backups, file-read and code-execution exploits, any debug log file and a heap dump. P1 "Leaks server configuration" for other debug and server info pages, such as a
phpinfo()page. - Signal: File, not a page when the answer was not HTML, such as an
.envfile or a log. Unique page when it was HTML unlike your site's catch-all page. - Response and Size: the status code and content type of the latest answer, and the largest size served.
- Exposed Since: the first
200for the path in all stored data, not only the period. - Last Fetched and Fetches: the latest request that got the content, and how many did in the period. The Fetches number opens those requests in Data Explorer.
EdgeComet decides from the status code, content type, title and size of each answer. A Unique page row can be an ordinary page that happens to sit at that path: open the URL to confirm.
What does each probe target?
Each probe path falls into one category, by what it targets. Probe Categories shows each category's share of probe requests, and Probe Requests Over Time stacks the categories per time bucket.
| Category | What scanners look for | Examples |
|---|---|---|
| Secrets & Keys | Environment files, cloud credentials, private keys and AI assistant configs | /.env, /sendgrid.env, /.aws/credentials, /id_rsa, /client_secrets.json, /.claude/settings.local.json |
| Source Control | Repository folders and files that expose source code and its history | /.git/config, /.github/workflows/deploy.yml, /.svn/, /.hg/ |
| Config & Backups | Config files, database dumps and backup copies | /docker-compose.yml, /settings.py, /wrangler.toml, /wp-config.php.bak, /backup.sql.gz, /www.zip |
| Debug & Server Info | Debug pages, status pages and logs | /phpinfo.php, /actuator/env, /_ignition/health-check, /elmah.axd, /server-status, /wp-content/debug.log |
| File-Read Exploits | Path traversal and file-read tricks | /../../etc/passwd, /@fs/proc/self/environ, /api/fs/read, /userfiles?path=../../.env |
| Code-Execution Exploits | Endpoints that run code an attacker sends, and known web shells | /cgi-bin/php-cgi, /vendor/phpunit/.../eval-stdin.php, /api/v1/validate/code, /wso.php, a .php file under /wp-content/uploads/ |
| Admin & Login | Admin panels and login pages | /wp-login.php, /wp-admin/, /xmlrpc.php, /phpmyadmin, /manager/html |
A path that matches no listed name but has a segment starting with a dot, such as /.pgpass, counts as Config & Backups, except paths under /.well-known/. So does a backup archive named after your site, such as /example.com.zip.
A probe by its query string alone, such as /document.php?file=../conf/conf.php, counts under the category of its payload: File-Read Exploits for a path to read, Code-Execution Exploits for code to run, Secrets & Keys for a cloud metadata address and Debug & Server Info for phpinfo=.
The chart's time buckets are in UTC, and their width follows the period. Click a bar or a category count to open those requests in Data Explorer.
How does your site answer probes?
Every probe request gets one outcome, from the status code and the content of the answer. Probe Outcomes shows each outcome's share, worst first. Most counts open the requests in Data Explorer.
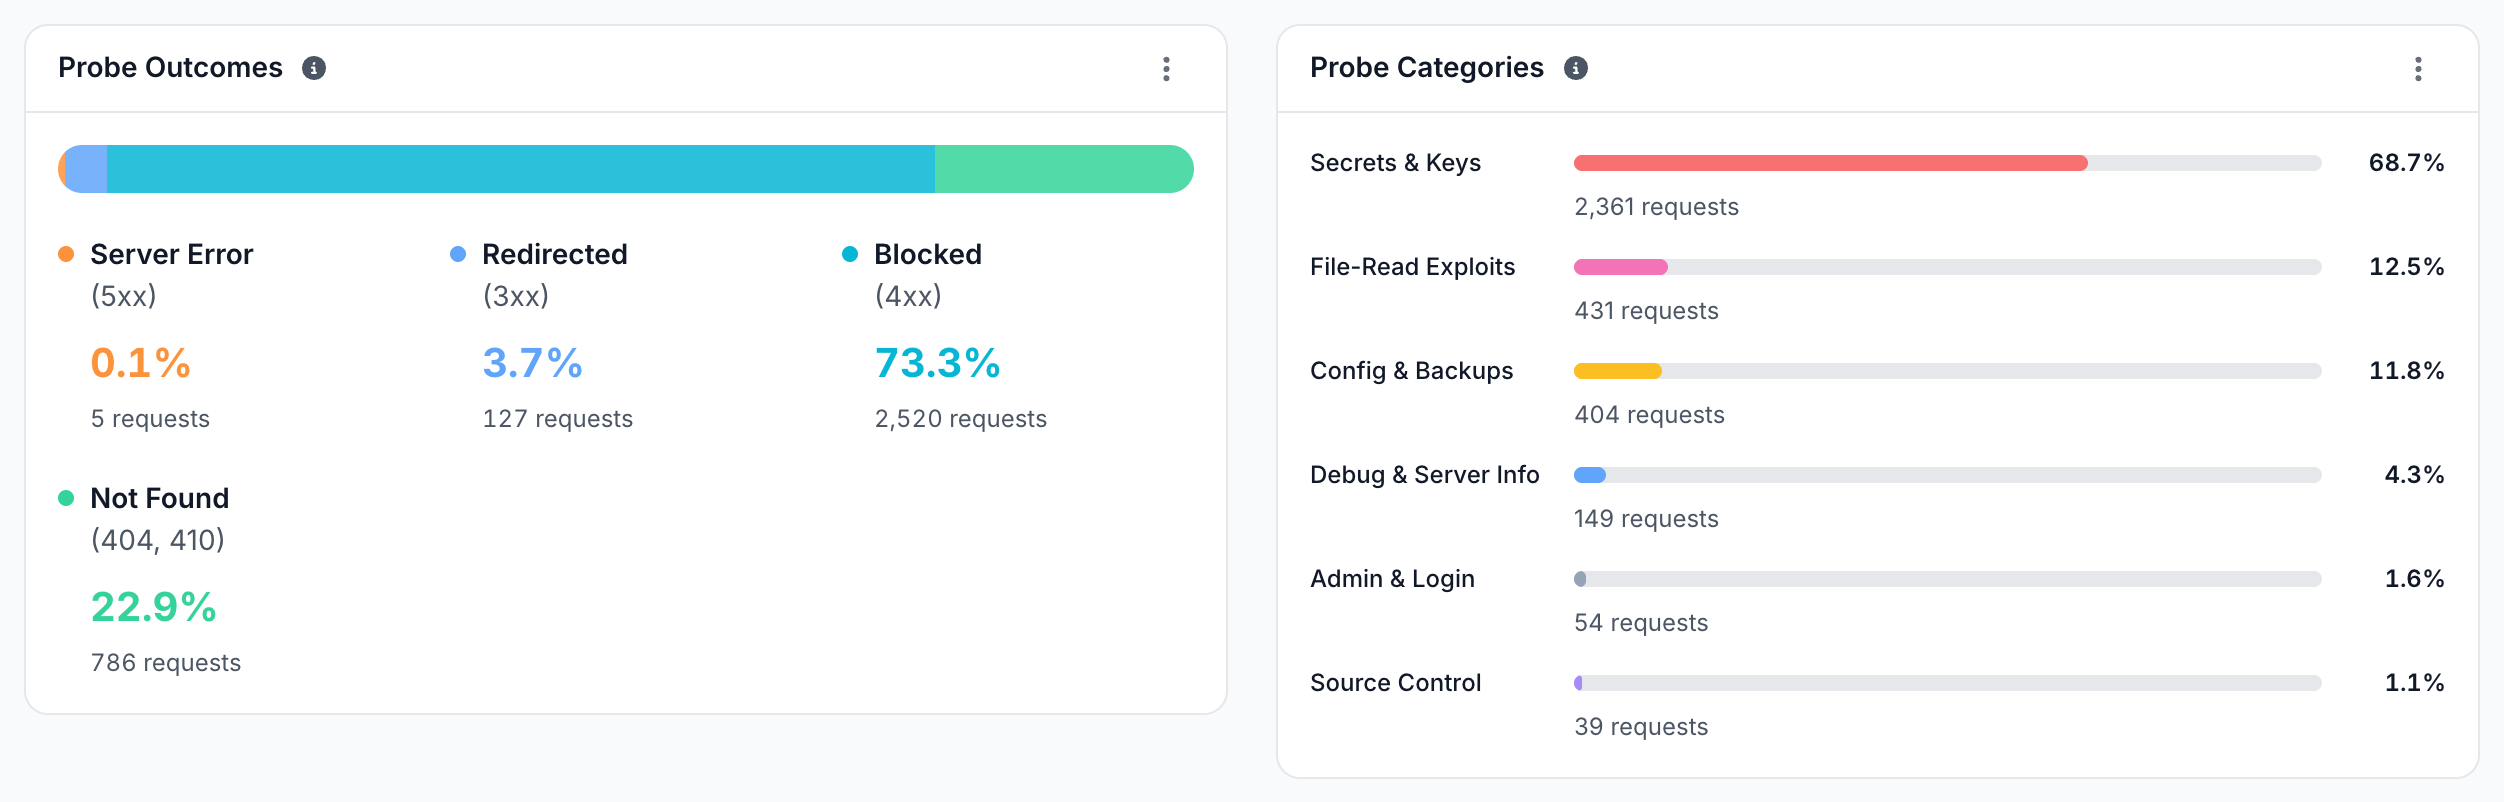
| Outcome | Answer | What it means |
|---|---|---|
| Exposed | 2xx with content | The path served a file or page. See Which files are exposed? |
| Same Page | 2xx with the catch-all page, an ordinary page to a query string payload, or an image | Your site answers unknown paths with one page, the page ignored the payload, or an image came back. Nothing leaked |
| Server Error | 5xx or no response | The request failed on your server or got no answer |
| Login Reachable | 2xx on an admin or login path | A login page answers, such as /wp-login.php |
| Redirected | Any 3xx | The probe was sent elsewhere |
| Blocked | 401, 403, 429 or another 4xx | Your server, firewall or a URL rule refused the probe |
| Not Found | 404 or 410 | The healthy answer |
Turned Away on the stat card is Redirected, Blocked and Not Found together.
Why do probes count as Same Page?
A catch-all page is the one page your site serves with a 200 for any path it does not know, such as a single-page app shell or a bot challenge page. EdgeComet recognizes it when several probe paths get the same page, by title and size, and counts those answers as Same Page instead of Exposed.
When EdgeComet finds one, the page opens with a notice that quotes the page title: "Every unknown path on this site answers 200 with the same page ("One moment, please..."), so these probes count as Same Page, not Exposed."

Which paths do scanners probe?
Probed Paths lists every probed path with its category, the worst answer it got in the period, its requests, the distinct IPs that asked and the last request.
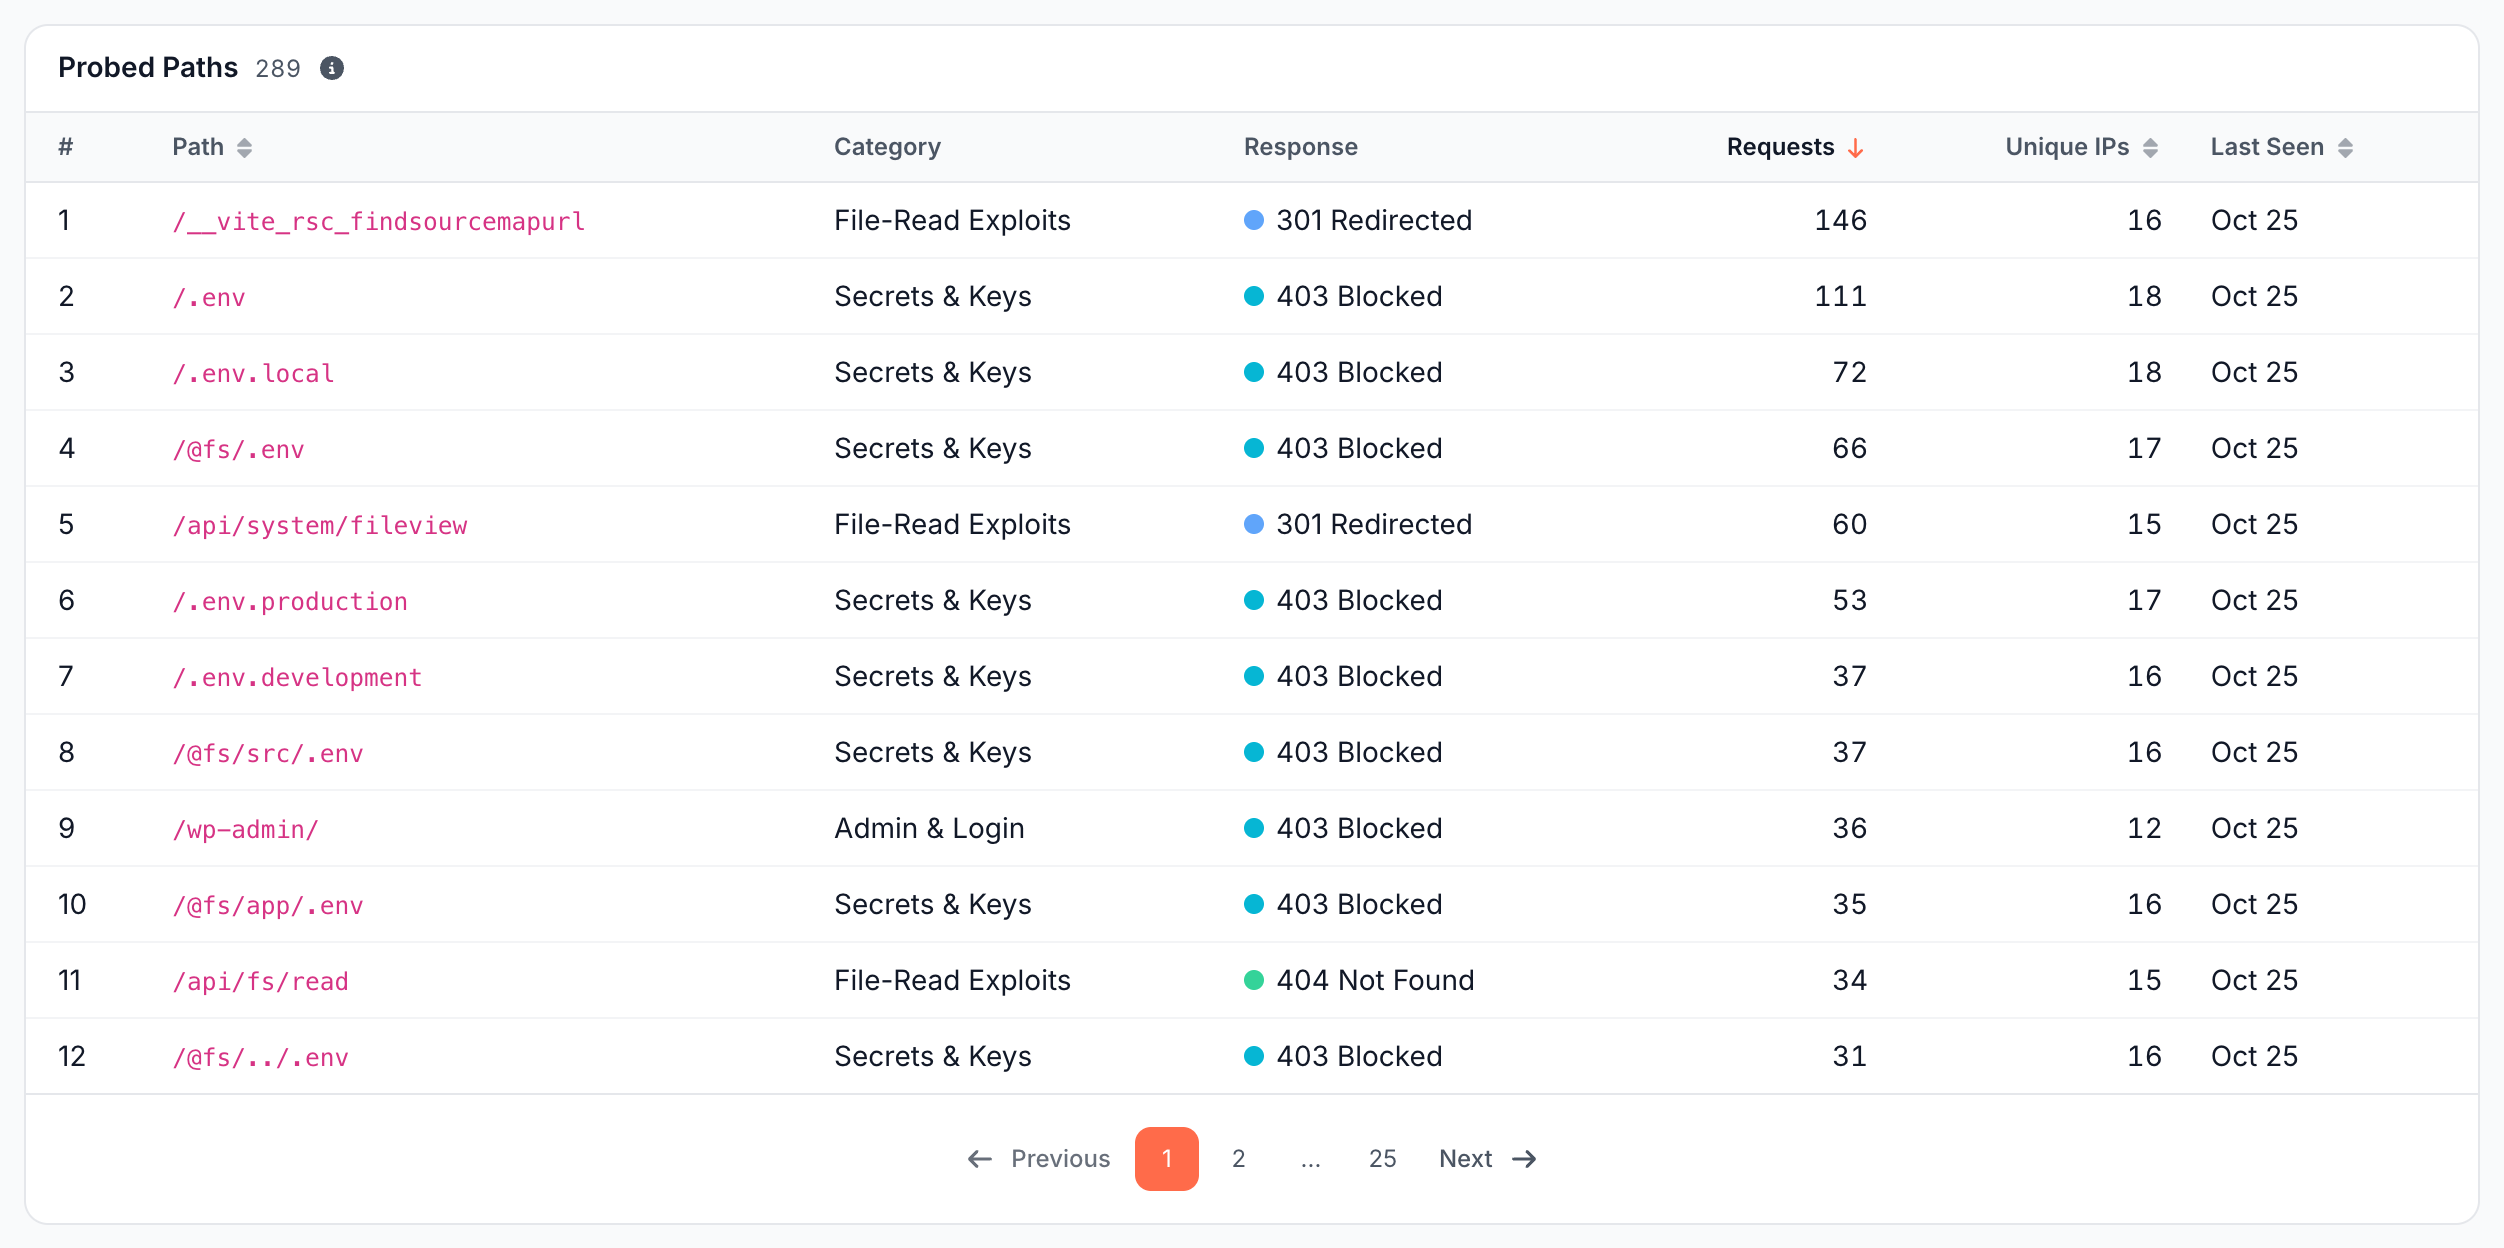
Response shows the status code and the outcome, with Exposed and Same Page as colored badges. Sort by Path, Requests, Unique IPs or Last Seen. The Requests number opens that path's requests in Data Explorer.
Who is probing?
Scanner IPs lists the IP addresses that sent probe requests, most active first.
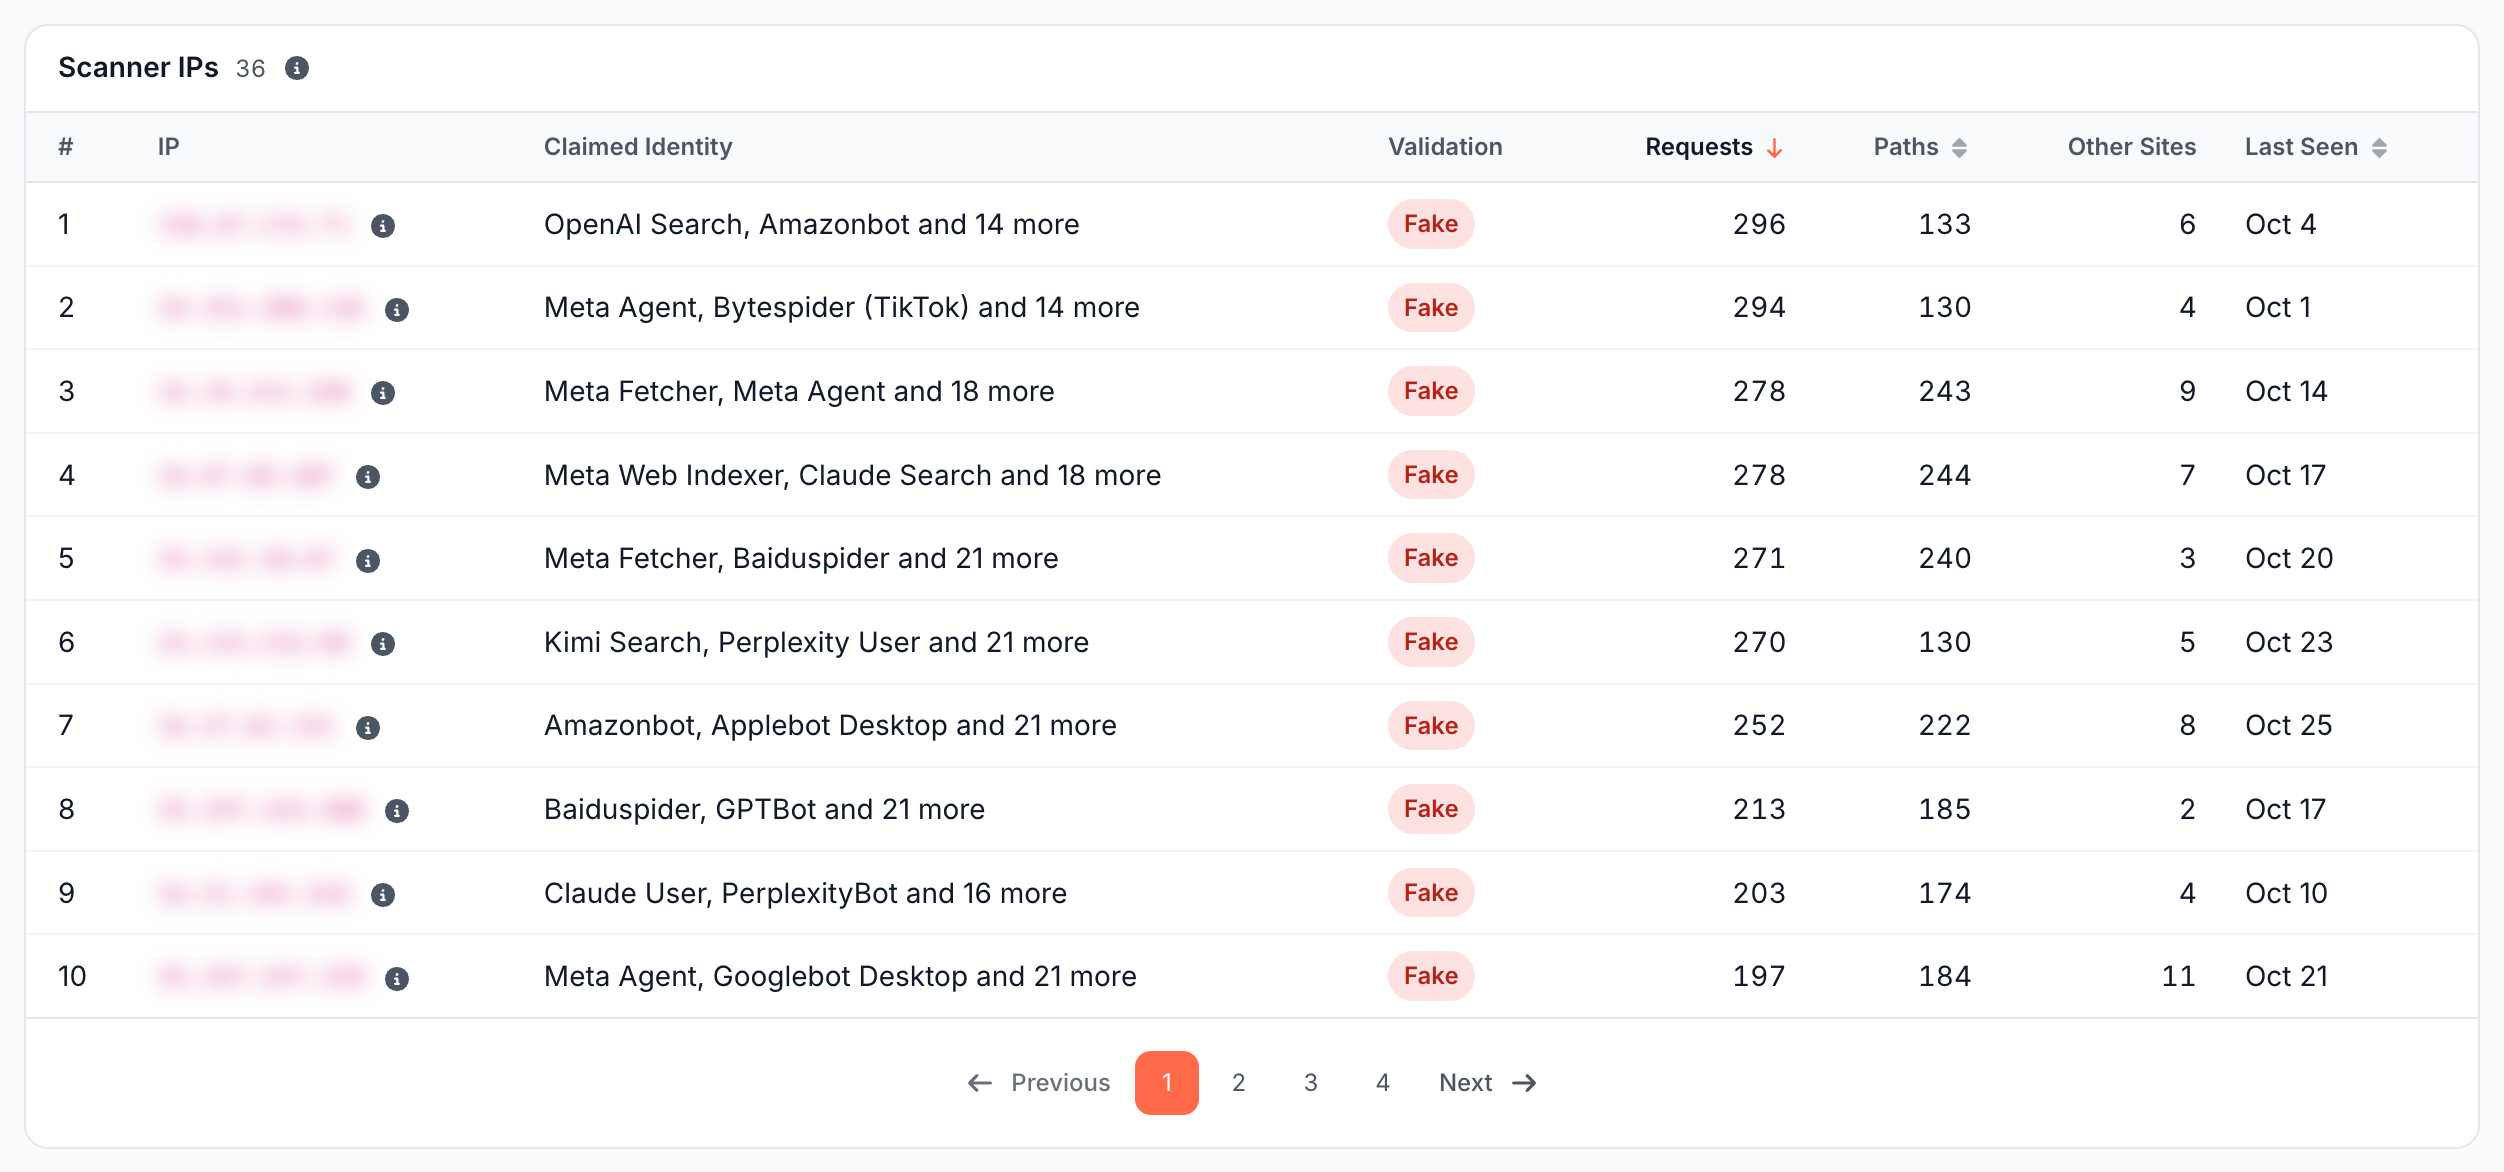
- Claimed Identity: the bots named in the user agents the IP sent. One scanner often rotates through many.
- Validation: Fake when any request from the IP failed the claimed bot's IP verification. Unverified otherwise: the claimed bot has no published IP list, or the user agent names no known bot.
- Requests, Paths and Last Seen: probe requests from the IP, the distinct paths it tried, and its latest request.
- Other Sites: how many other EdgeComet sites the same IP probed in the period. It shows a count, never which sites.
The icon next to an IP opens a WHOIS lookup of the network owner. Sort by Requests, Paths or Last Seen.
How to read it
Read the Security page by what got through, then by who sent it:
- Exposed Files is above zero. Treat every P0 file as leaked, and fix it the same day.
- Turned Away is under 100%. Check which outcome got through. Same Page leaks nothing, Login Reachable is expected only for software you run, and Exposed needs a fix.
- Same Page is large. Your site answers unknown URLs with
200. Nothing leaked, but a200for a missing page is what Google calls a soft 404. - Server Error appears. A probe path made your server fail. Find the path in Probed Paths.
- One IP claims many bots and reads Fake. That is a scanner rotating user agents, not a real crawler.
- Other Sites is high. The IP scans many sites, not only yours.
- No probe requests in this period. EdgeComet saw none, which does not mean nobody probed your site. EdgeComet records the requests your CDN routes to it, and a scanner with a browser user agent goes straight to your origin. See Request-path capture.
How to fix an exposed file
Fix an exposed file at your origin first, then make probes for it get a 404:
- Remove the file from your web root, or deny the path in your web server or CDN.
- Rotate every secret the file held, such as API keys, database passwords and tokens. A file that answered a scanner with a
200counts as leaked. - Request the path yourself and check that it answers
404or403. New probes then show as Not Found or Blocked, and the row leaves Exposed Files once the period no longer includes an exposed fetch.
Answer probe paths at the edge
To answer common probe paths before they reach your server, add a URL rule under Configuration > System Settings > URL Rules. Use Wildcard patterns such as /.env*, /.git/* and *.sql, and the action Not Found (404) or Block (403).
Wildcards ignore case, and * matches any characters, none included: /.env* covers /.env and /.env.local. See Add a URL rule.
Pick only paths your site never serves on purpose. A URL rule applies to the requests your CDN routes to EdgeComet: direct requests to your origin still reach the file, which is why the origin fix comes first.
What to do next
Set the alert, inspect the requests, and check the rest of your bad bot traffic:
- Get alerted. The Sensitive file exposed alert warns you when a probed file answers with content. It checks once a day and counts files, not pages. See Sensitive file exposed.
- See every request. Most counts on the page open the matching requests in Data Explorer > Bot log, with filters such as Probe category and Response class set. See Data Explorer Bot log.
- Ask about it. Ask in the header starts with "Is any sensitive file exposed?", "Which paths do scanners probe?" and "Where do probes come from?".
- Check fake and unknown bots. Log Analyzer > Bad Bots covers fake Googlebot traffic and unknown crawlers. See Detect fake Googlebot and other bad bot traffic.
How this compares with server logs and vulnerability scanners
The Security page shows what real scanners asked your site for and what your site answered, from live traffic:
- Server log analysis: finding probes in access logs takes your own path patterns, and a
200in a log line cannot tell a leaked file from a catch-all page. The Security page classifies every probe and its answer, recognizes your catch-all page, and dates each exposure. - Vulnerability scanners: a scanner tests your site from outside, on a schedule and with its own list. The Security page shows which paths scanners requested between those runs, which ones answered, and since when.
- Across sites: Other Sites shows when the same IP probed other EdgeComet sites, which your own logs cannot show.
See How EdgeComet collects data: no log files, no crawler.
Where to find it
In the dashboard: Log Analyzer > Security. Log Analyzer > Bad Bots covers fake and unwanted bot traffic.