

Check one page's serve time, status codes and render errors
The Technical and Rendering tabs of EdgeComet Page Analysis show how one URL is delivered to bots: how many requests it got, how fast EdgeComet answered, how often from the cache, which status codes bots received, and how its renders went.
Use them when one page stands out in a site report, such as a slow page in Status codes, response times and page sizes bots receive or a failing page in Monitor renders and JavaScript errors.
Technical: is the page served fast and without errors?
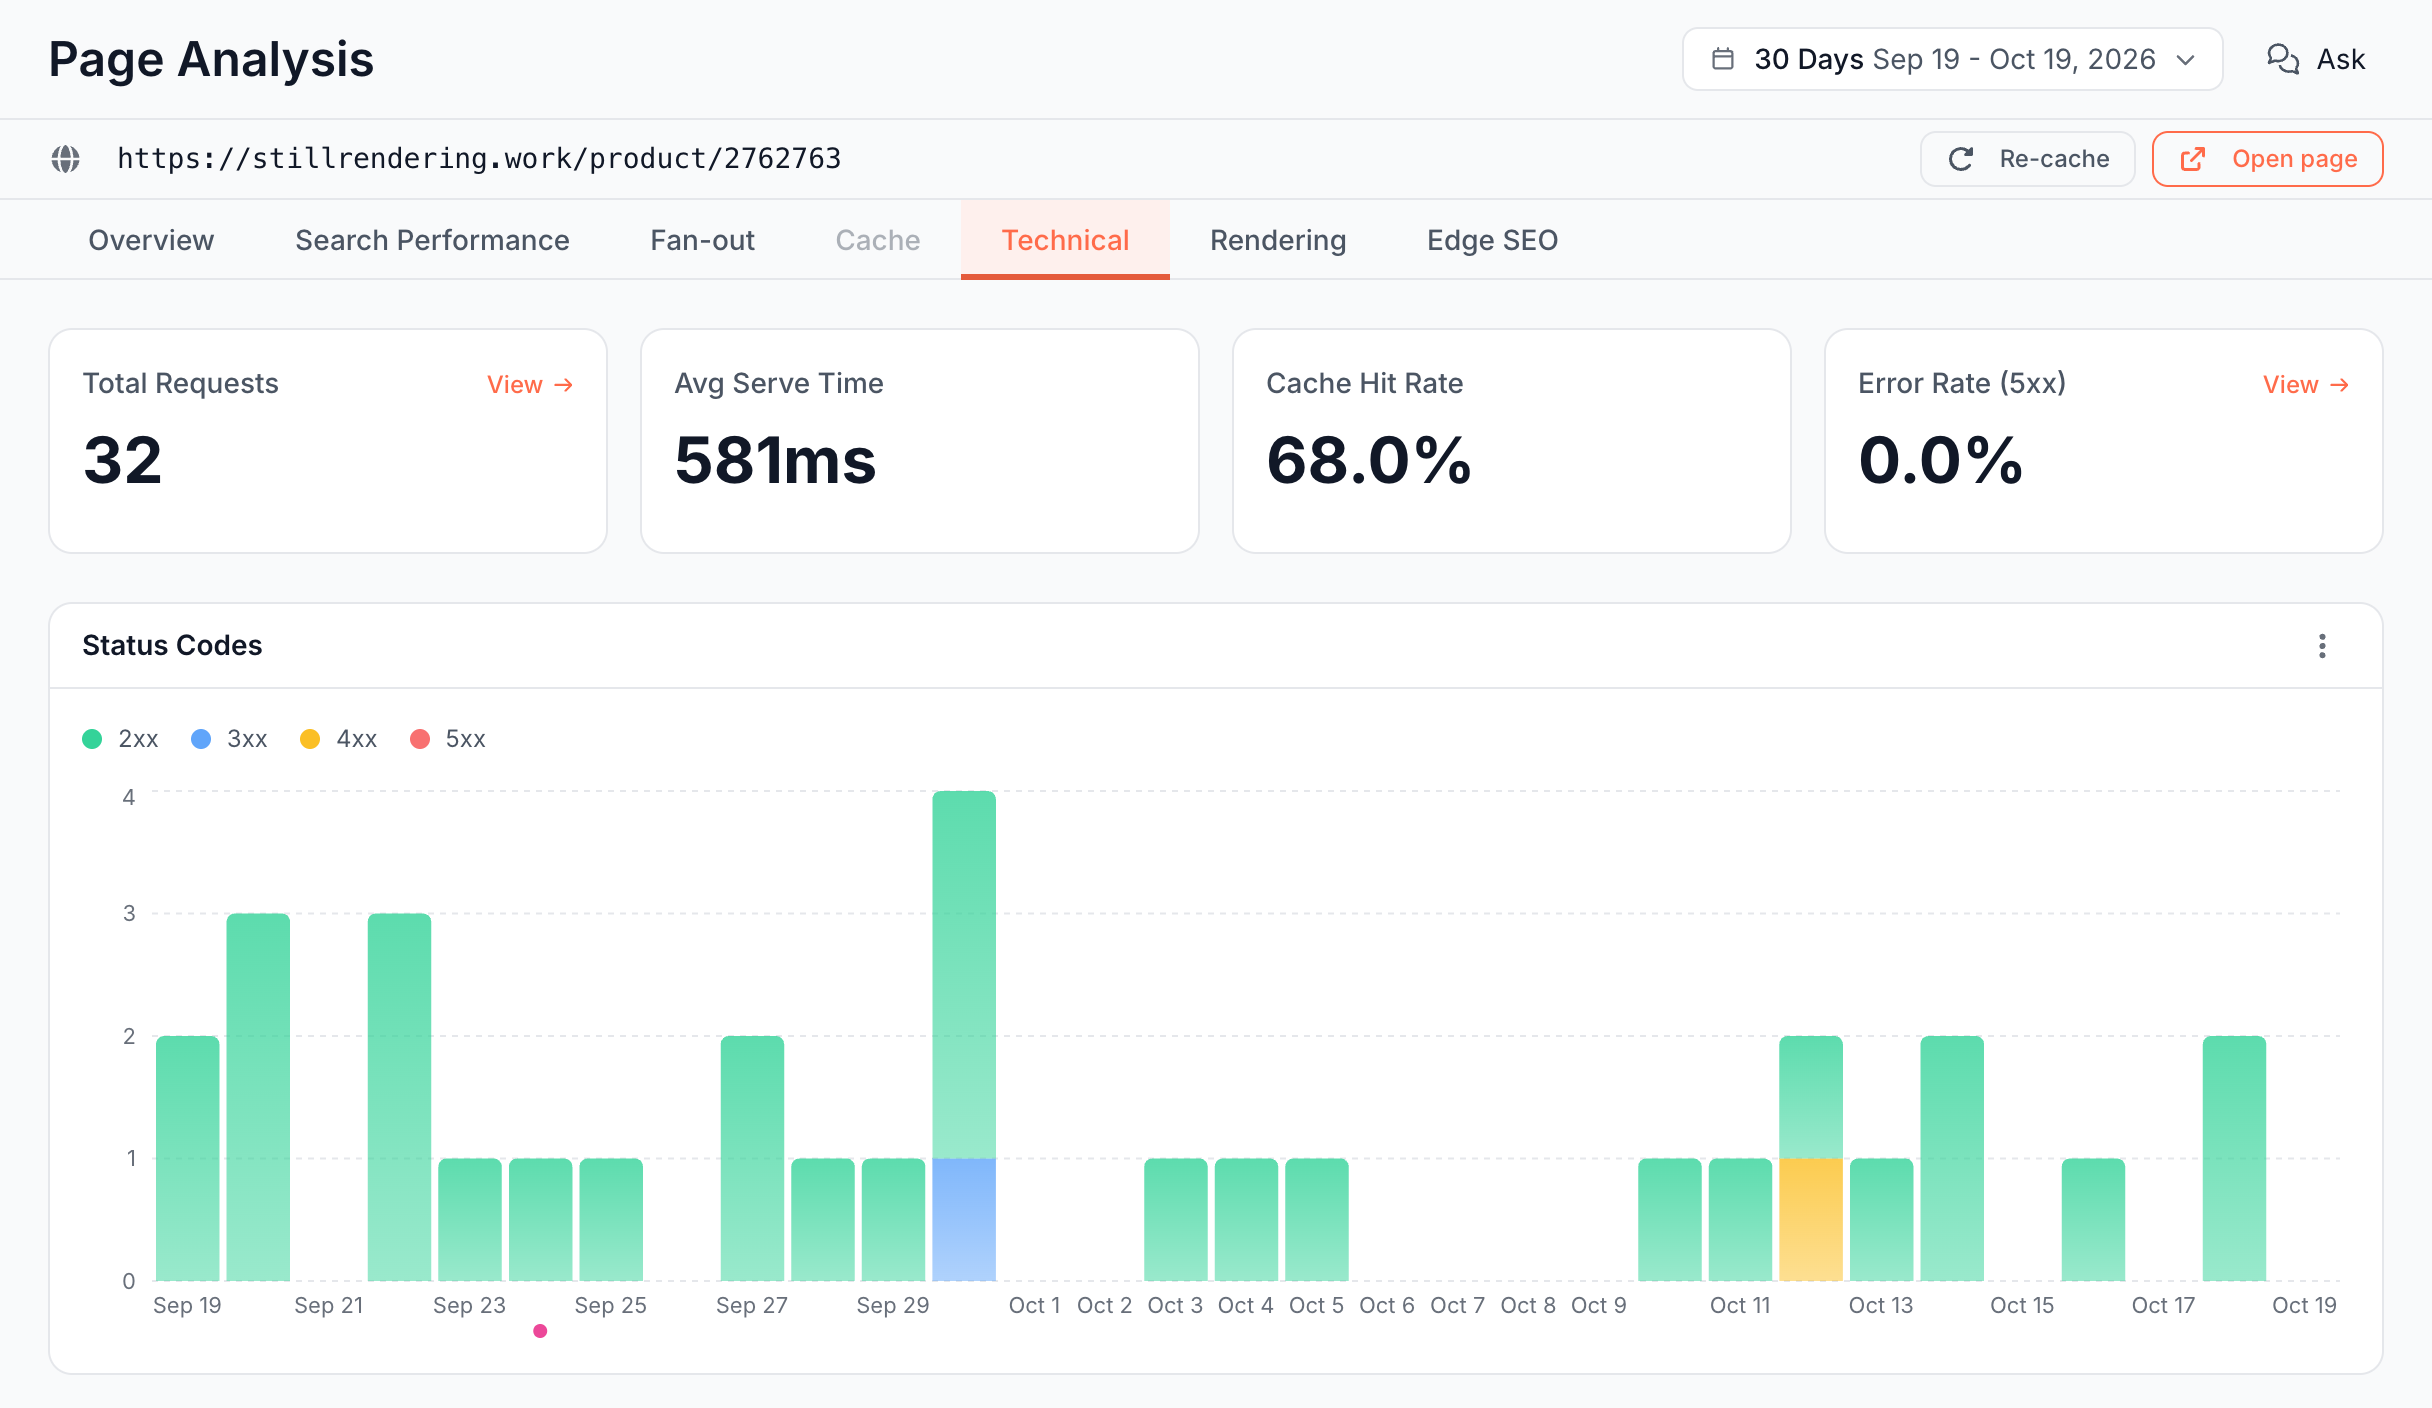
The Technical tab counts the requests EdgeComet served to bots for the URL in the period. Requests from fake bots are left out.
Technical stat cards: how many requests, how fast, how often cached?
- Total Requests: bot requests for the URL. Pre-cache refreshes are left out. View lists them in Data Explorer > Bot log.
- Avg Serve Time: the average serve time of those requests. A cache hit is served in under 15 ms and a fresh render takes seconds, which makes the share of renders the main driver of this number.
- Cache Hit Rate: requests answered from the cache, out of requests answered from the cache or by a fresh render. Its change is in percentage points. The site-wide cache hit rate is counted over every bot request EdgeComet served.
- Error Rate (5xx): the share of requests answered with a status of 500 or above. View lists them.
Status Codes: did bots get errors or redirects?
Status Codes stacks the page's requests over the period by status class: 2xx, 3xx, 4xx and 5xx.
Serve Time: did the page get slower?
Serve Time draws the page's average serve time over the period, for responses with status 200.
Rendering: how does the page render for bots?
The Rendering tab shows the renders of the page in the period: EdgeComet loading the page in headless Chrome and running its JavaScript. See Prerender JavaScript pages for search and AI bots.
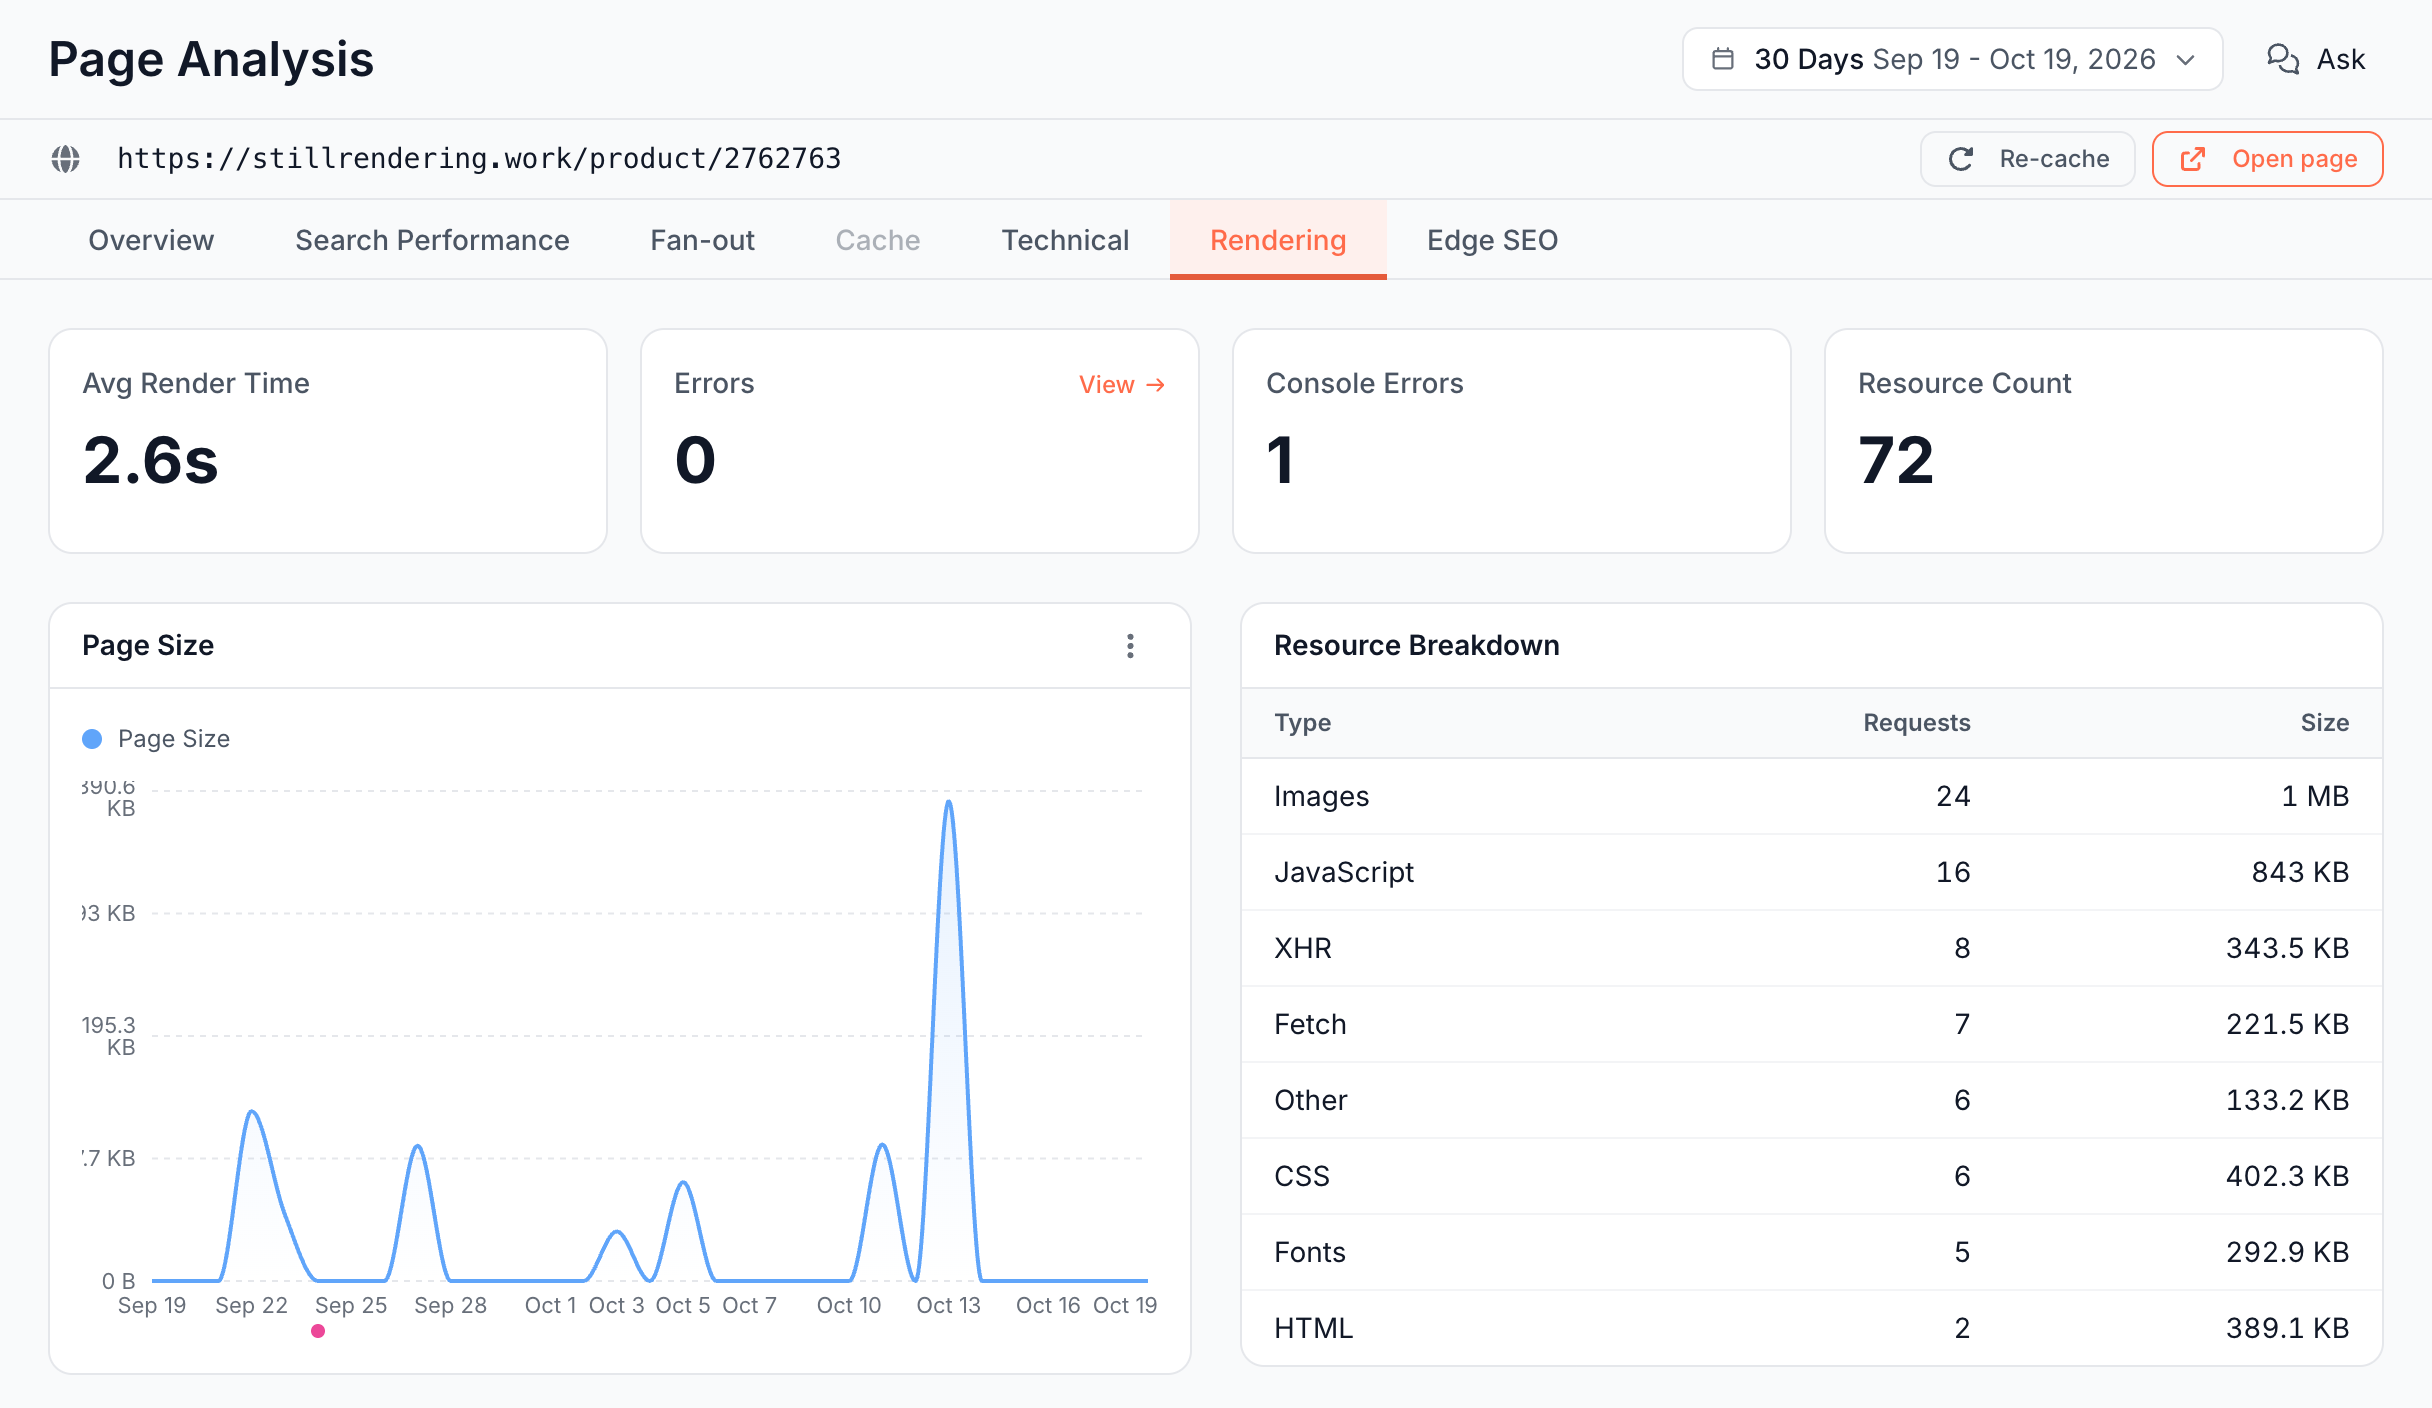
Rendering stat cards: how long do renders take, and do they fail?
- Avg Render Time: the average time of the renders that finished without an error.
- Errors: renders that failed. View lists them in Data Explorer > Bot log. For failures across the site, see the Issues tab in Monitor renders and JavaScript errors.
- Console Errors: the average number of JavaScript errors the page wrote to the browser console per render.
- Resource Count: the average number of files the page requested per render.
Page Size and Resource Breakdown: how heavy is the page?
Page Size draws the size of the rendered page over the period. Resource Breakdown splits the files the page loaded by Type, such as Images, JavaScript, XHR, Fetch, CSS, Fonts and HTML, with their Requests and Size. With no renders in the period, it reads "No resource data available".
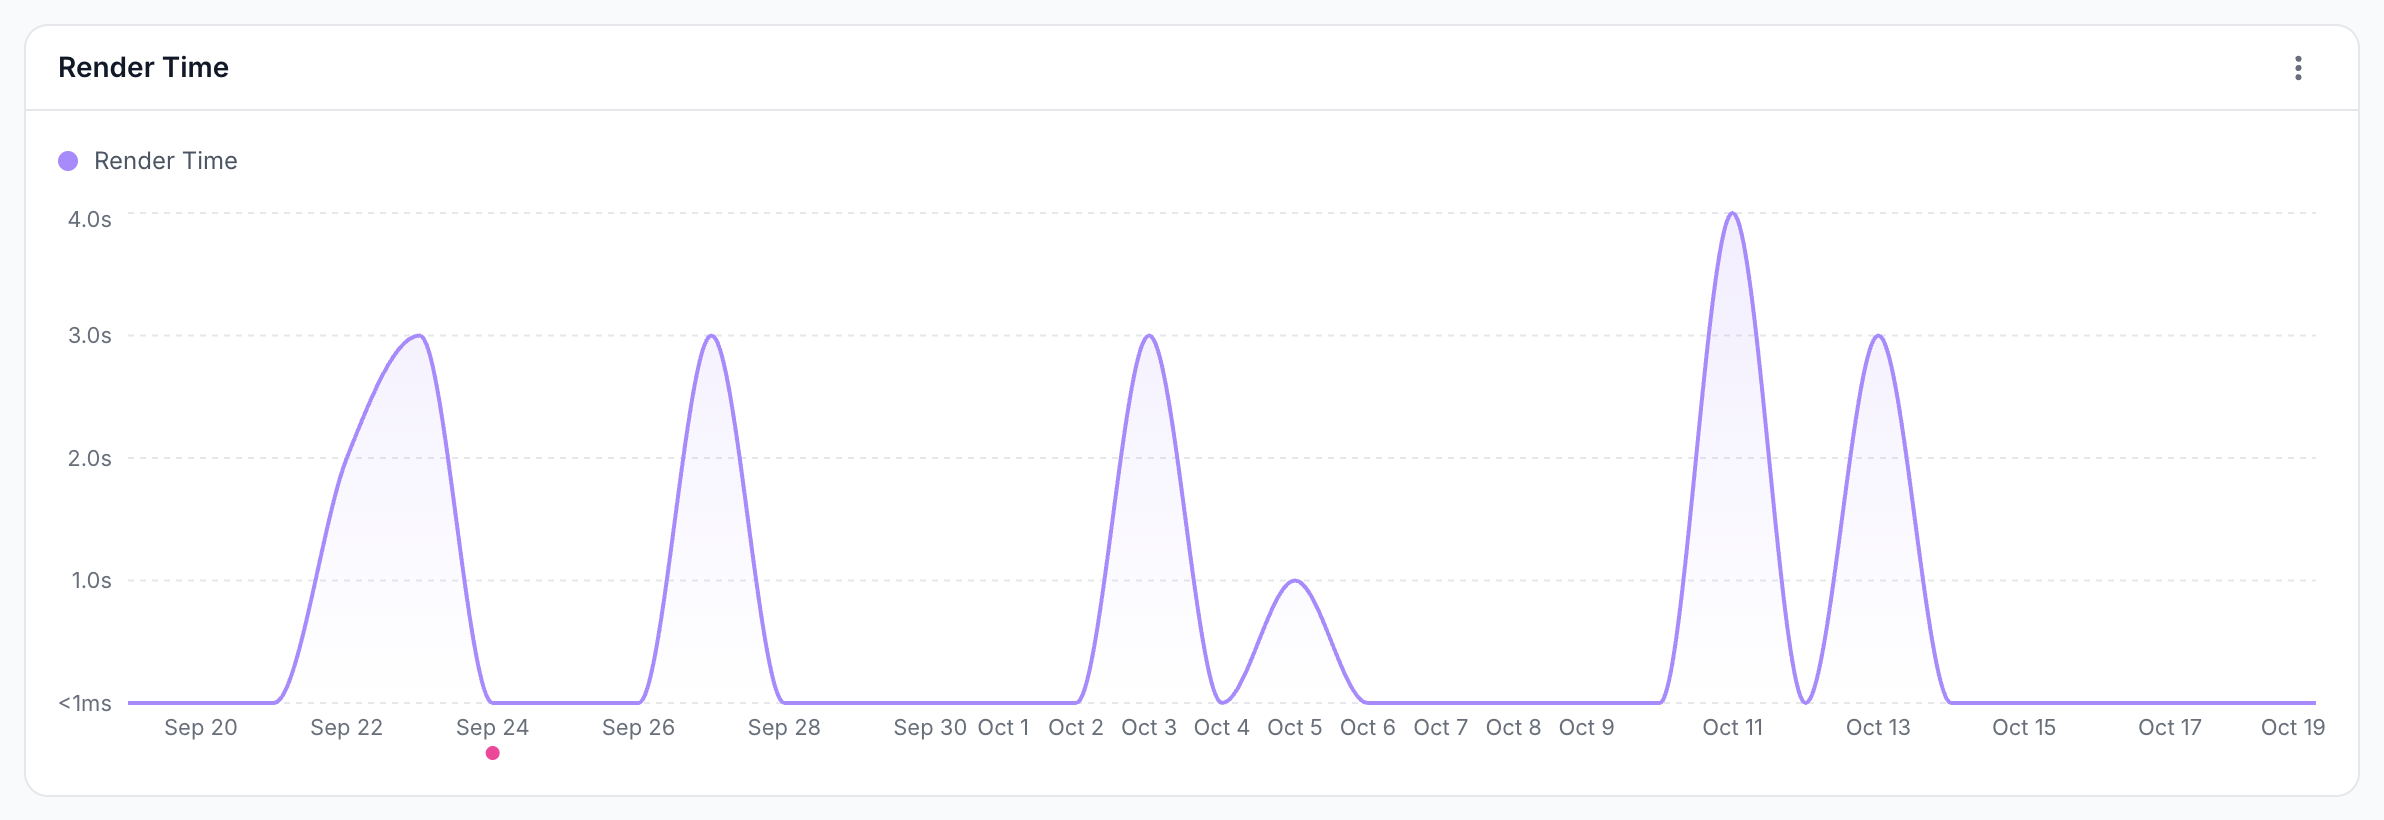
Render Time: are renders getting slower?
Render Time draws the average render time over the period. A render that reaches the render timeout is captured as the page shows at that moment, which can leave out content that loads late. See Fix blank, partial or slow prerendered pages.
JS Errors Trend and Console Errors: which scripts fail?
JS Errors Trend draws the page's JavaScript errors over time. Console Errors lists the errors with their Error Message, Count, Source and Last Seen, and each row opens the matching renders in Data Explorer > Bot log. A page with no errors reads "No errors found".
How to read it
- A high Avg Serve Time with a low Cache Hit Rate. Bots often get fresh renders. Longer cache lifetimes and pre-cache rules keep a copy ready. See How EdgeComet keeps cached pages fresh.
- 5xx bars. Bots got a server error, often because your server failed while EdgeComet fetched or rendered the page. With Serve stale content if origin is down, bots get the expired copy instead of the error. See When cache expires: serve stale or delete.
- Render time close to the timeout. Heavy scripts or slow API calls hold the render. Check Resource Breakdown for the heaviest types, then see Fix blank, partial or slow prerendered pages.
- Console errors on every render. A script fails for the rendering browser. The page may miss content that script builds: compare the cached copy with the live page.
What to do next
- Slow serves: keep a copy ready before bots ask with Pre-cache pages before bots request them.
- Render errors: see Fix blank, partial or slow prerendered pages.
- The whole site: compare with every page in Monitor renders and JavaScript errors.
Where to find it
In the dashboard: Page Analysis > Technical and Page Analysis > Rendering for a URL.