

Edit a custom report
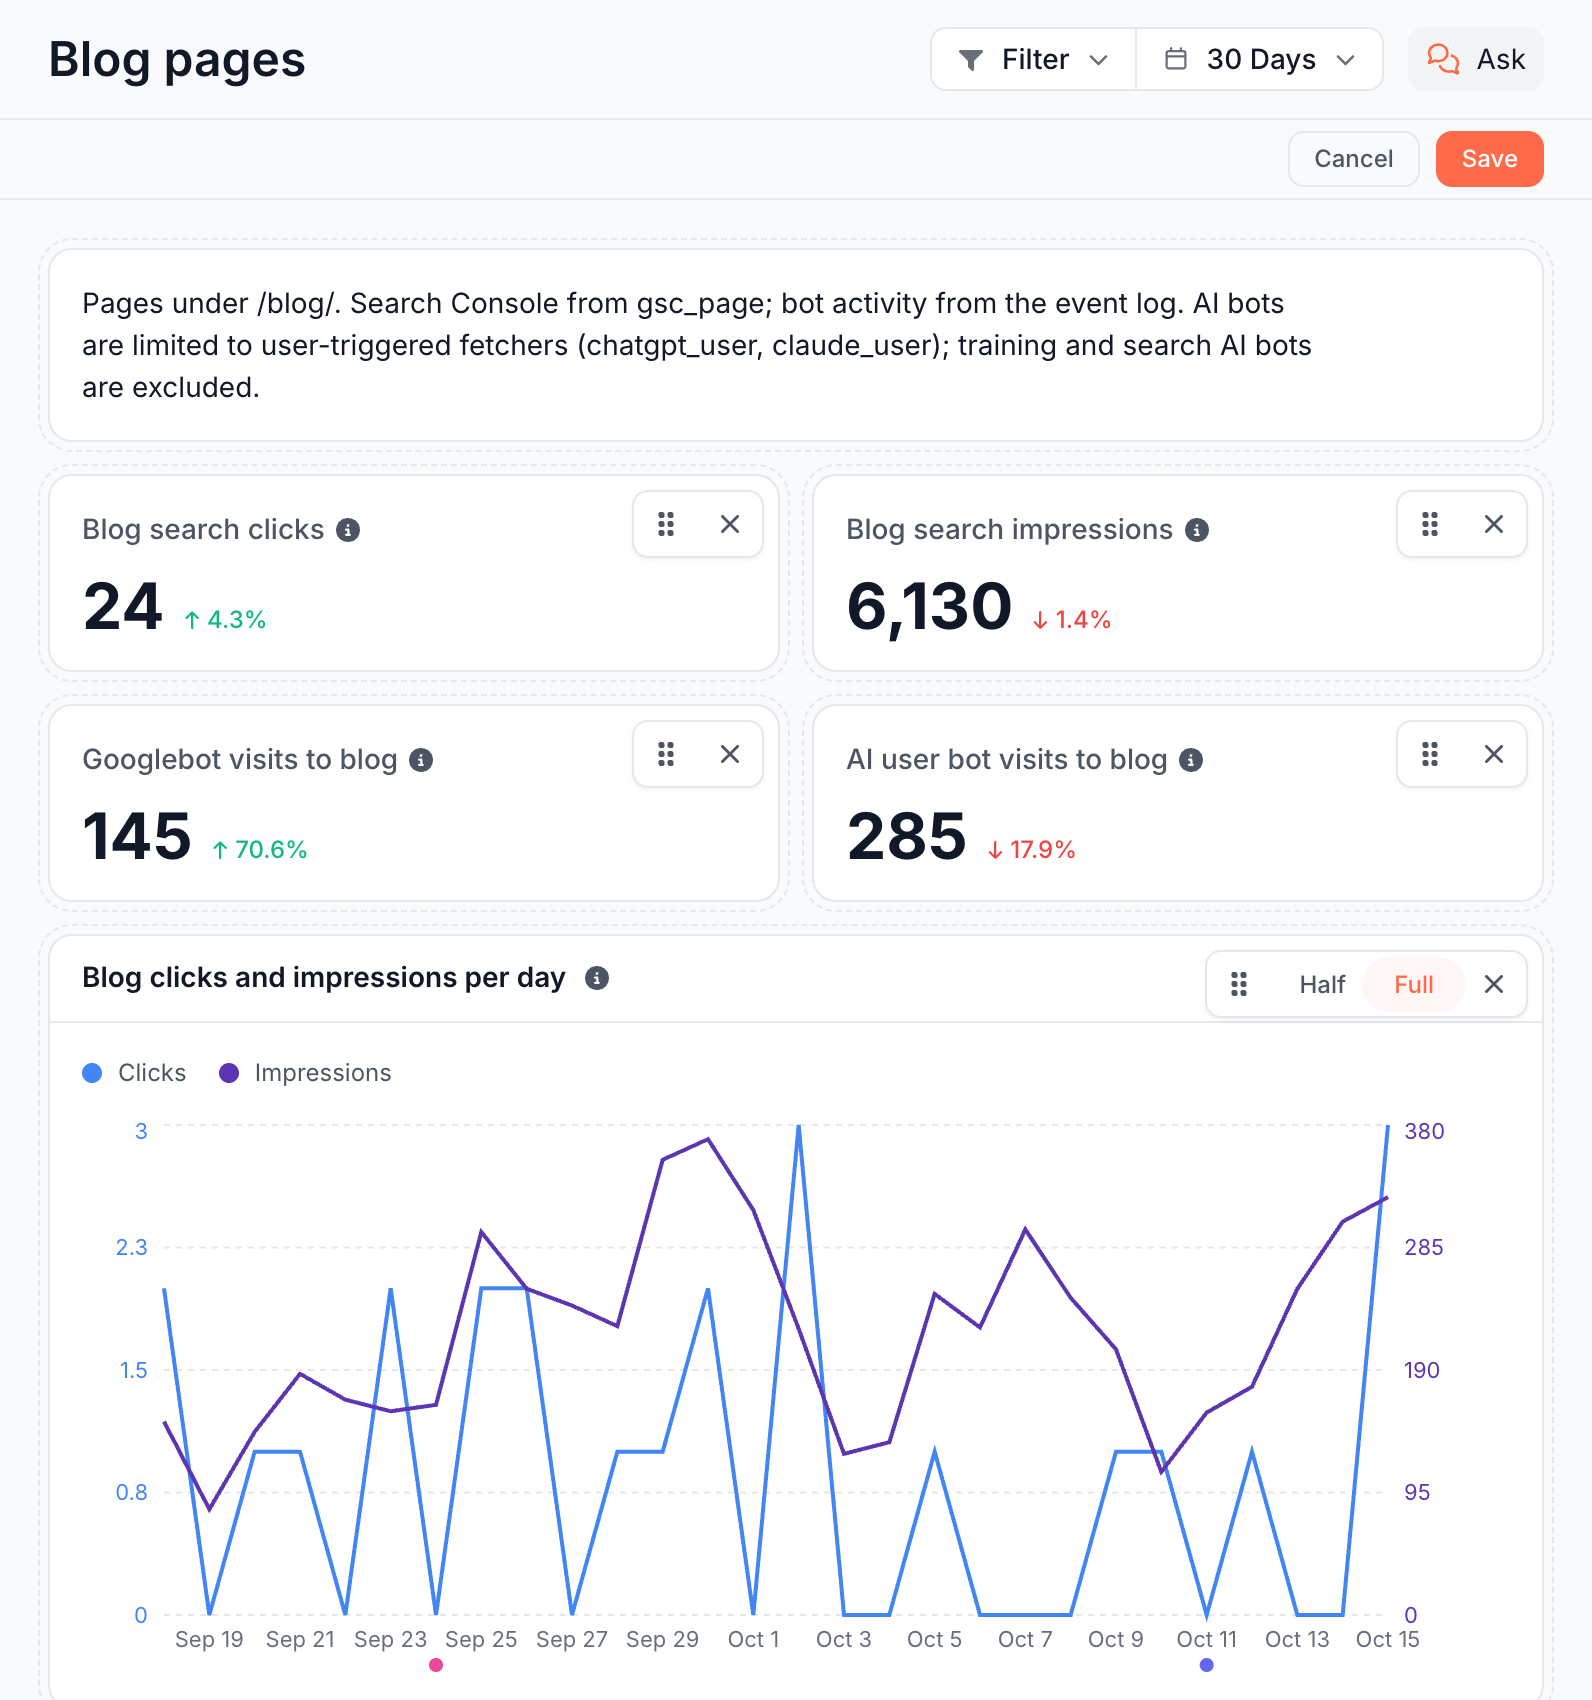
Edit report changes the layout of a saved custom report: move, resize, add and delete blocks, and rewrite the report's description. Also called editing the report layout.
You add a block by describing it. The chat beside the report builds it from your data and drops it where you clicked Add block.
Nothing changes until you click Save, which makes a new version of the report.
Before you start
- Edit the latest version. Edit report appears on the latest version only. To edit an earlier one, restore it first. See Versions.
- Let the chat finish. While the chat beside the report is answering, Edit report is disabled with "Wait for the chat to finish".
Steps
- Open the saved report and click Edit report. The Ask panel opens beside it, on the report's own conversation.
- To move a block, drag its grip, or focus the grip and use the arrow keys.
- To resize a chart or table, pick Half or Full on its card.
- To remove a block, click Delete on its card and confirm.
- To add a block, click an Add block tile and describe the block. See Add a block.
- To change the description, edit the description card above the blocks.
- Click Save. The report opens on the new version.
Cancel leaves edit mode and drops every change. Saving with no change closes edit mode without making a version.
Block kinds
A report block is one card of a custom report: a stat, a chart or a table that holds its own query. A report holds 1 to 12 blocks.
| Kind | What it shows |
|---|---|
| Stat | One number and its change against the previous period of the same length. For a position or a duration, a lower value counts as an improvement. |
| Line | A metric over time. The engine picks hours, days, weeks or months from the period. |
| Bar | One value per category, such as Googlebot fetches per folder. |
| Pie | Shares of a total, such as requests per bot family. |
| Table | Rows and columns, 10 rows per page by default, with paging through every row. |
A line chart draws either of two shapes:
- One metric split by a field, such as AI bot fetches per bot. The six largest series get their own line and the rest fold into "Other".
- Two to four metrics, each on its own scale, such as clicks, impressions, CTR and position. The first two scales show as the left and right axes, tinted to their line. The third and fourth read from the tooltip.
A position scale runs top down, with position 1 at the top. Search Console metrics keep the colors Search Console uses.
Each block has a title of up to 80 characters and a description of up to 300 that says what it measures. Every block follows the period and segment of the page.
Layout and widths
The report is a grid four columns wide:
- Stats are quarter-width cards that share a row.
- Line, bar, pie and table blocks are Half or Full width. Two half blocks in a row share it, and a half block with no half beside it leaves the rest of its row empty.
- A gap in a row, and the end of the report, shows an Add block tile in edit mode.
Your browser keeps the column widths you drag in a table, and they survive new versions. Your team does not see them.
Add a block
- Click an Add block tile in a gap or at the end of the report.
- In Add a block, describe the block, such as "Googlebot fetches per day, or the 404 pages bots fetch most".
- Click Add block.
The tile reads "Building the block in the chat" while the chat works, and the new block appears in its place. When the chat needs an answer from you first, the tile reads "Reply in the chat to build the block" with Cancel.
The chat marks the answer "Added to Edit report". If you close edit mode before it lands, it reads "Not added: Edit report was closed". Any other report change you ask for in the chat during the edit lands in the edit too, until you save.
Add block tiles disappear once the report holds 12 blocks.
Delete a block
Click Delete on a card and confirm to take the block out of the layout. The dialog asks "Delete {title}?" and adds "The card leaves this layout. The report keeps it until you save."
Earlier versions keep the block. When you delete the last block, the report reads "No blocks left." and Save stays disabled until you add one.
Edit the description
In edit mode, the description card above the blocks becomes a field, "What this report covers", of up to 300 characters. Revert appears once you change it and puts back the saved description. Line breaks in the description do not survive the save.
Notes on a block
A note in a block's header shows when the block reads something other than what the page header selects:
- Crawl of {date}: the Evergreen Crawl the block read.
- Segment not applied: the block reads the whole site. Its tooltip gives the reason, such as a segment with rules other than URL, or Search Console site totals, which cover the whole property.
- Filter not applied: "The Filter rows on this page do not narrow report blocks: this block reads the whole site."
An empty chart reads "No data for this period".
If it does not work
Each message below names why an edit cannot save, and what to do.
"A report needs at least one block" or "A report needs a description"
Save stays disabled until the report has a block and a description. Add a block, or write a description.
"This report changed since you started editing. Reload to edit the latest version."
Someone saved a newer version while you edited, from Edit report or the chat. Reload the page and edit the latest version. The same fix applies to "This layout does not match the report. Reload to edit the latest version."
"This edit no longer matches the report. Cancel it and edit the latest version."
Someone changed the version your edit started from. Click Cancel, then Edit report again.
Where to find it
In the dashboard: Ask > Custom Reports, then a report and Edit report.