

Monitor renders and JavaScript errors
Are your pages rendering for bots, how fast, and what breaks along the way? Cache > Renders answers with four tabs: Overview, Performance, JS Errors and Issues. Each takes a period and a segment filter, and each number links to the requests behind it in Data Explorer.
What the report shows
Most panels count every render Chrome ran, for bots and for pre-cache rules. Bot Activity, Cache Performance and Indexability Health count renders made for bot requests only.
Overview: are pages rendering?
- Fresh Renders: renders that returned status
200with no error, with the previous period's count. - Failed Renders: renders that ended in an error, other than a soft timeout or a
4xxfrom your server, or that returned a5xx. The footer gives the failure rate. - Avg Render Time with the 90th percentile (P90), and Avg Page Size of the rendered HTML.
- Render Activity Over Time: fresh renders, soft timeouts and failures per day.
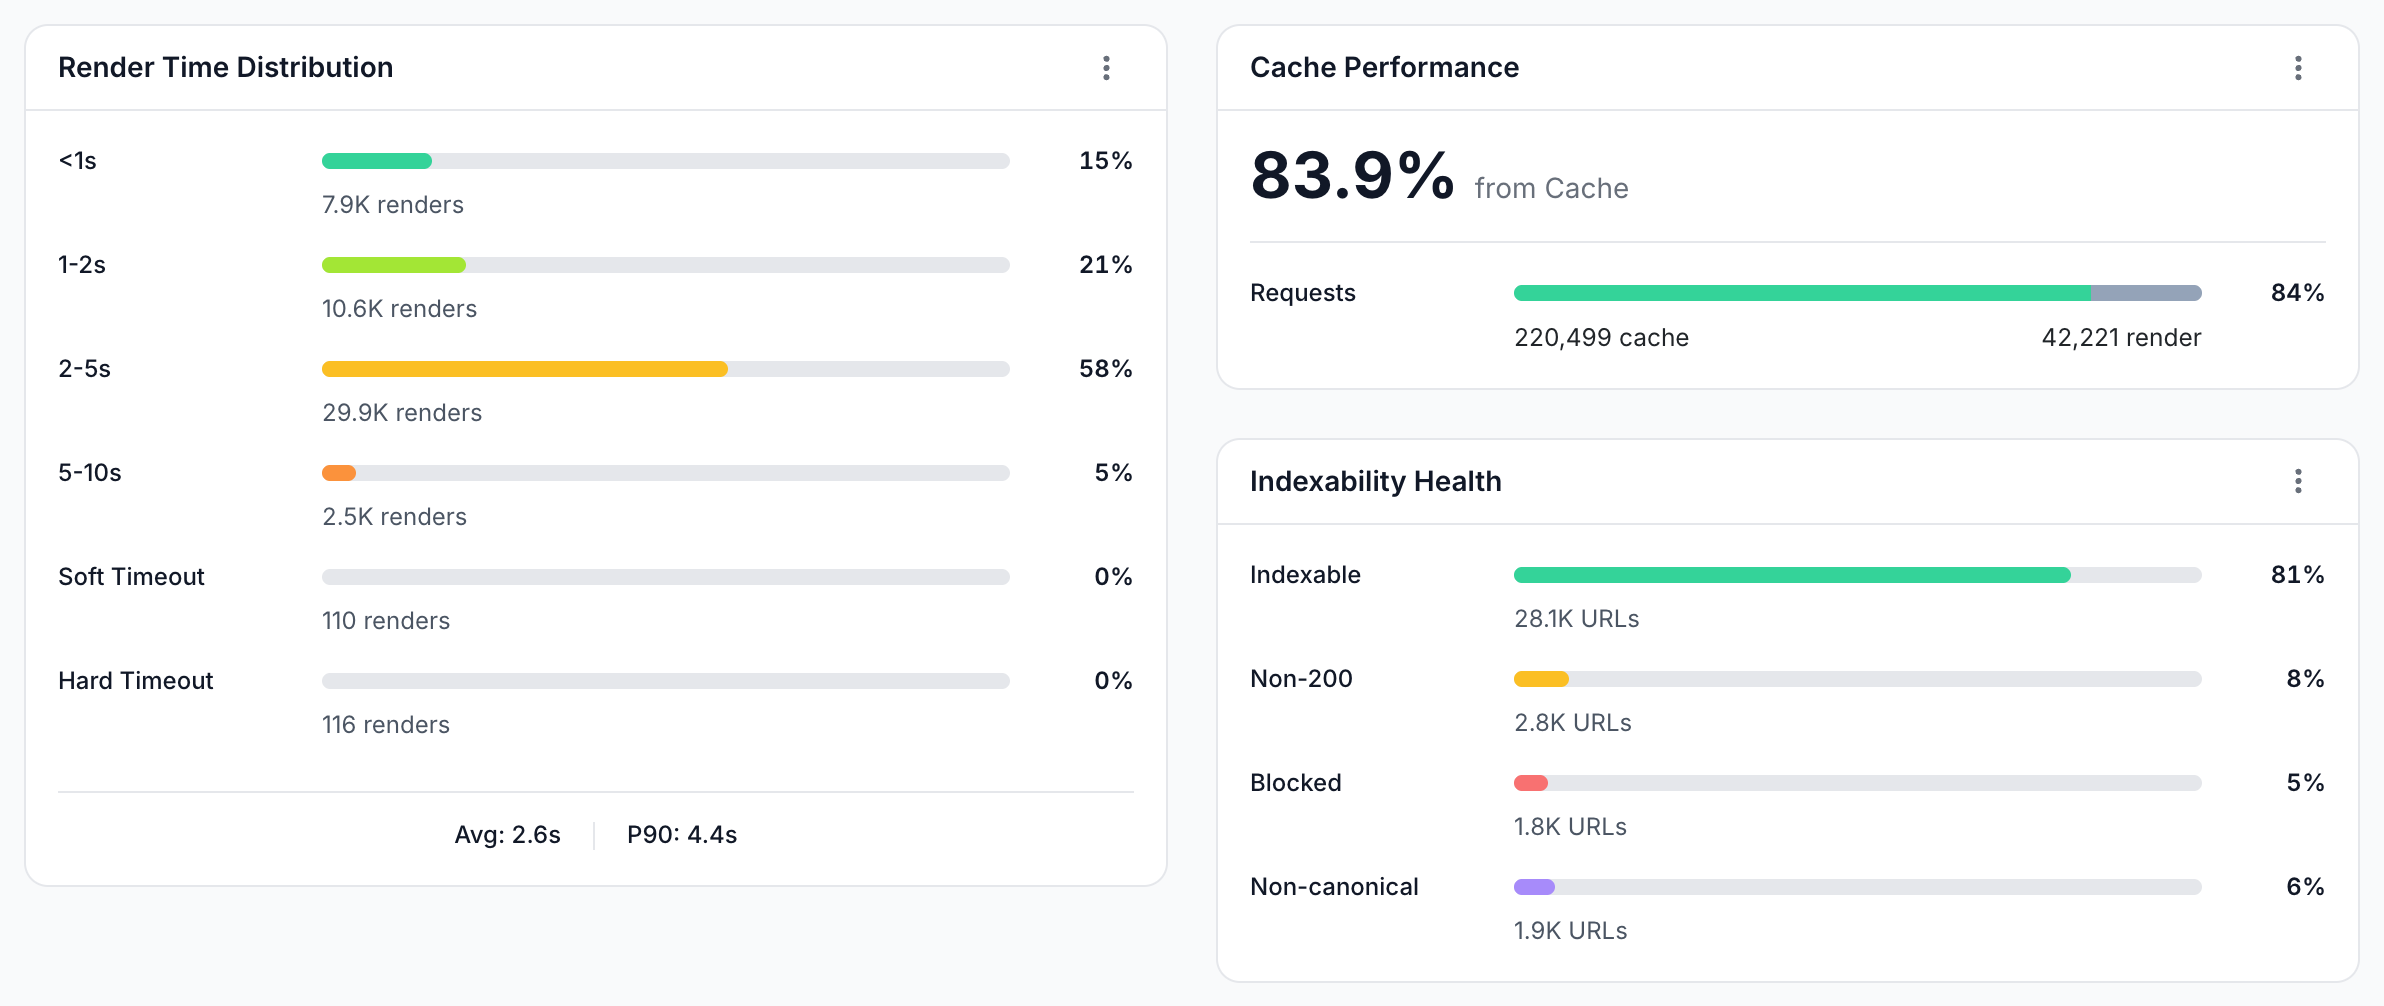
- Render Time Distribution: renders in time bands from <1s to >10s, plus Soft Timeout and Hard Timeout, with the average and P90 without timeouts.
- Cache Performance: the share of bot requests answered from the cache instead of a live render.
- Indexability Health: rendered URLs that were Indexable, Non-200, Blocked by a
noindex, or Non-canonical. - Bot Activity: renders per bot, grouped into Search Engines, AI Bots, Social Media, SEO Tools and Other Bots, with each bot's share, average render time, cache share and issues.
Performance: how heavy and slow are renders?
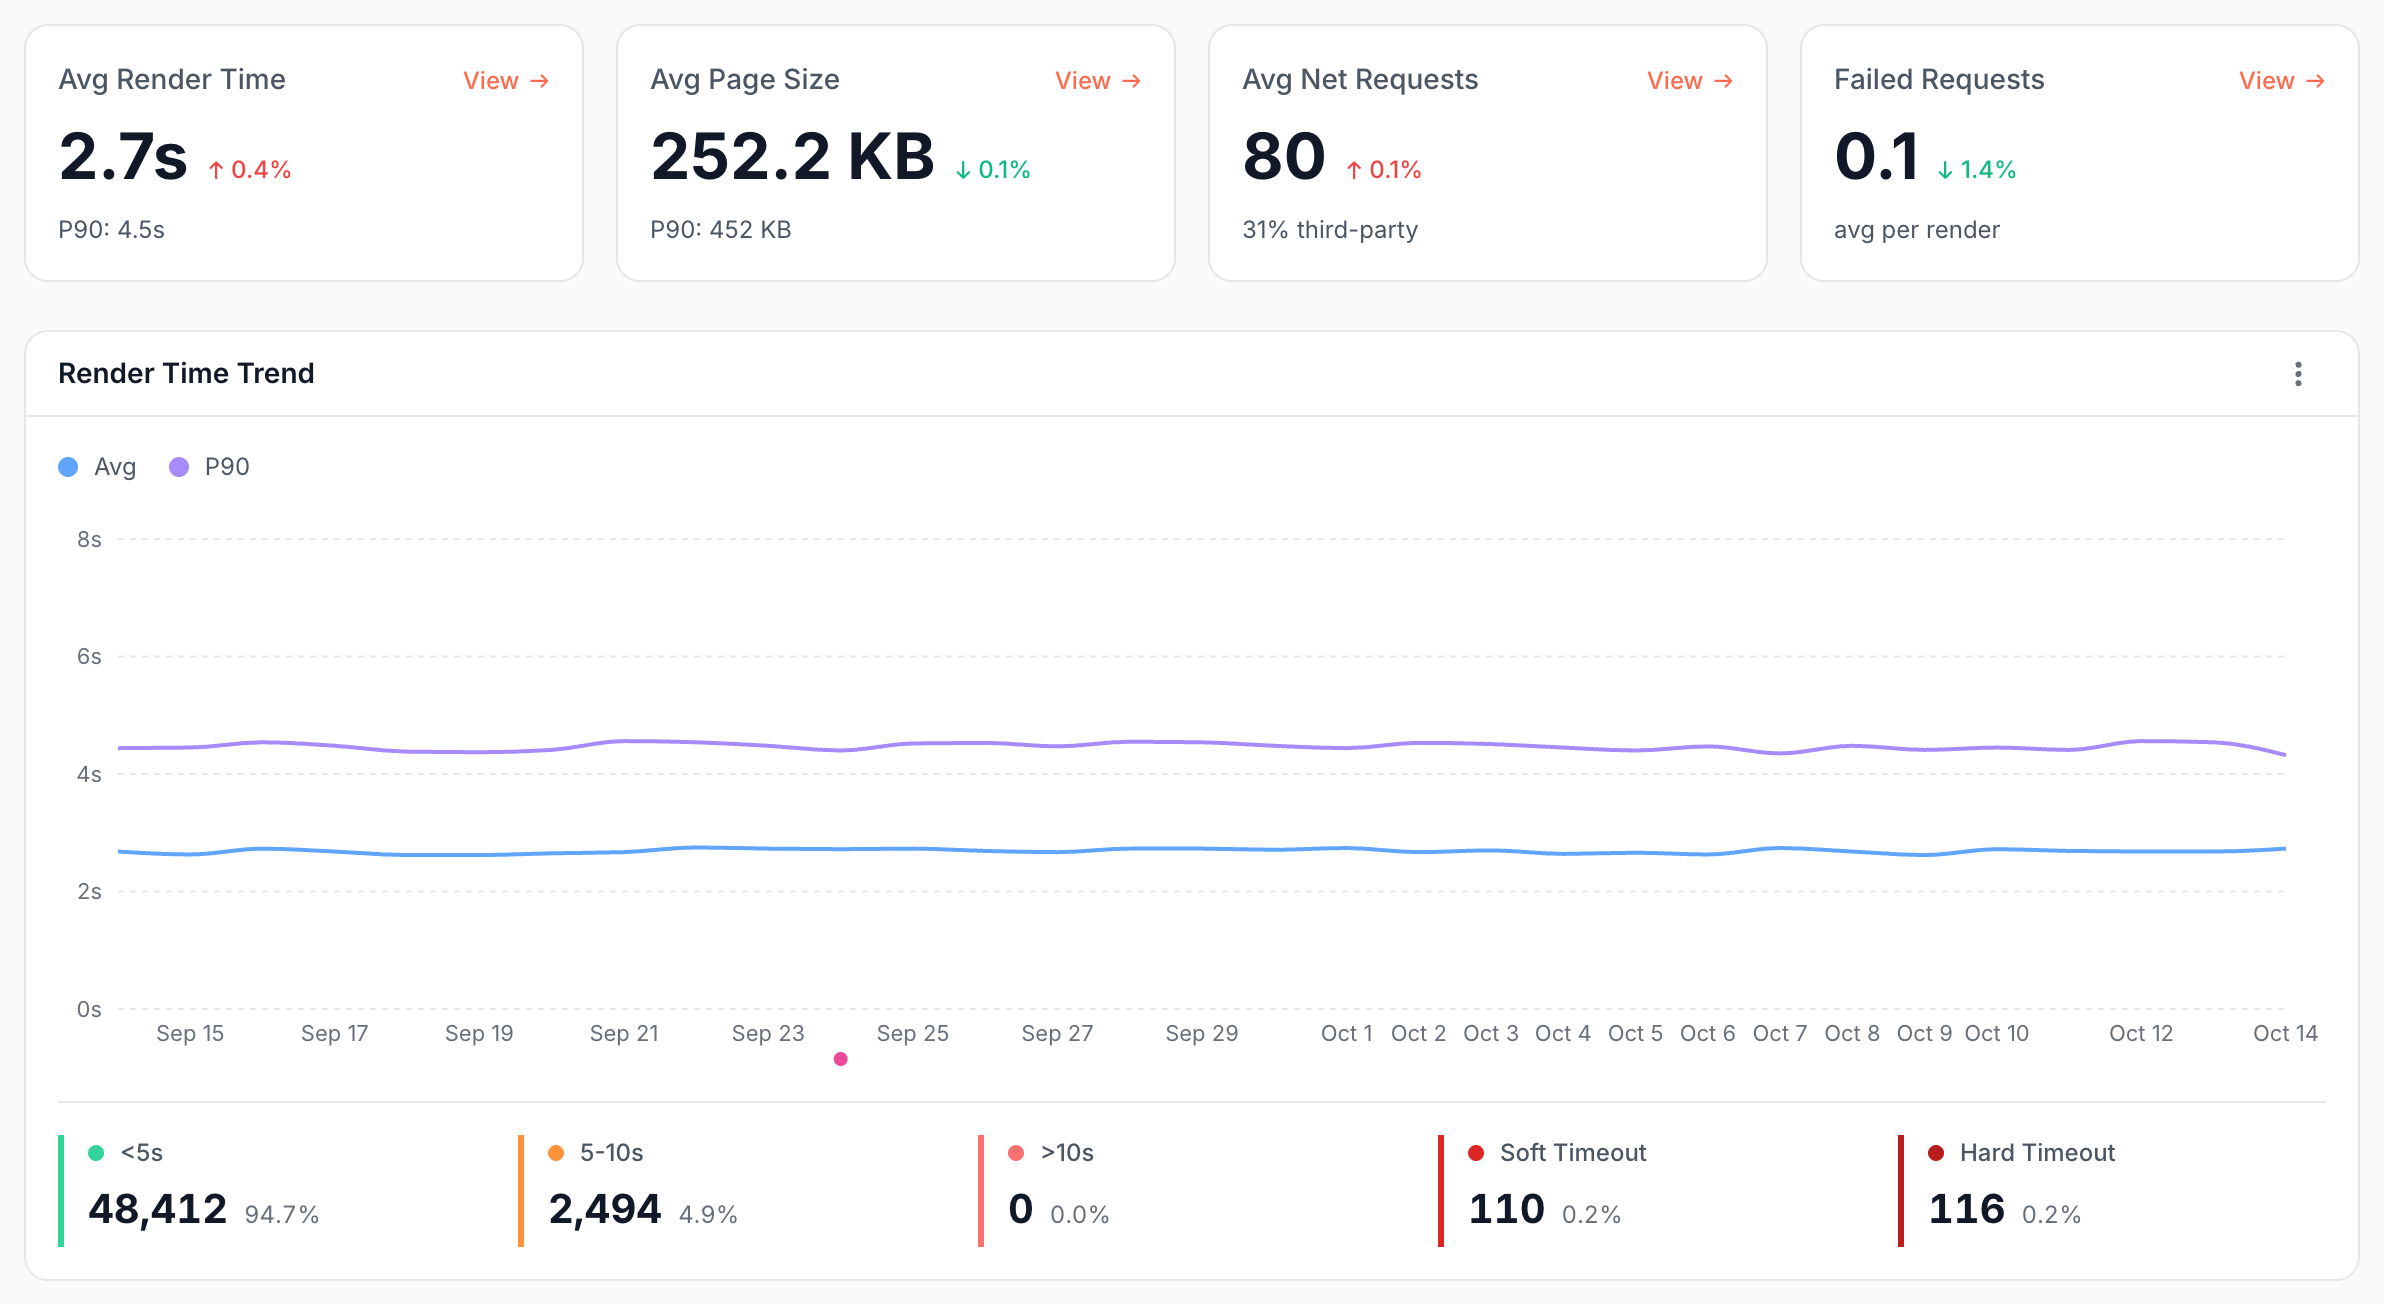
- Avg Render Time, Avg Page Size, Avg Net Requests with the third-party share, and Failed Requests, the average number of network requests per render that failed.
- Render Time Trend: average and P90 render time per day, with totals per time band.
- Page Size Distribution: rendered HTML in size bands.
- Page Weight Analysis: what a render downloads by type: images, JavaScript, HTML, CSS, XHR, fonts, fetch and other.
- Network Requests Analysis: first-party and third-party requests and bytes per render.
- Lifecycle Events: average and P90 time to each Chrome lifecycle event, such as
DOMContentLoaded,loadandnetworkIdle. Use it to pick a Wait For Event and a timeout.
JS Errors: what breaks in the browser?
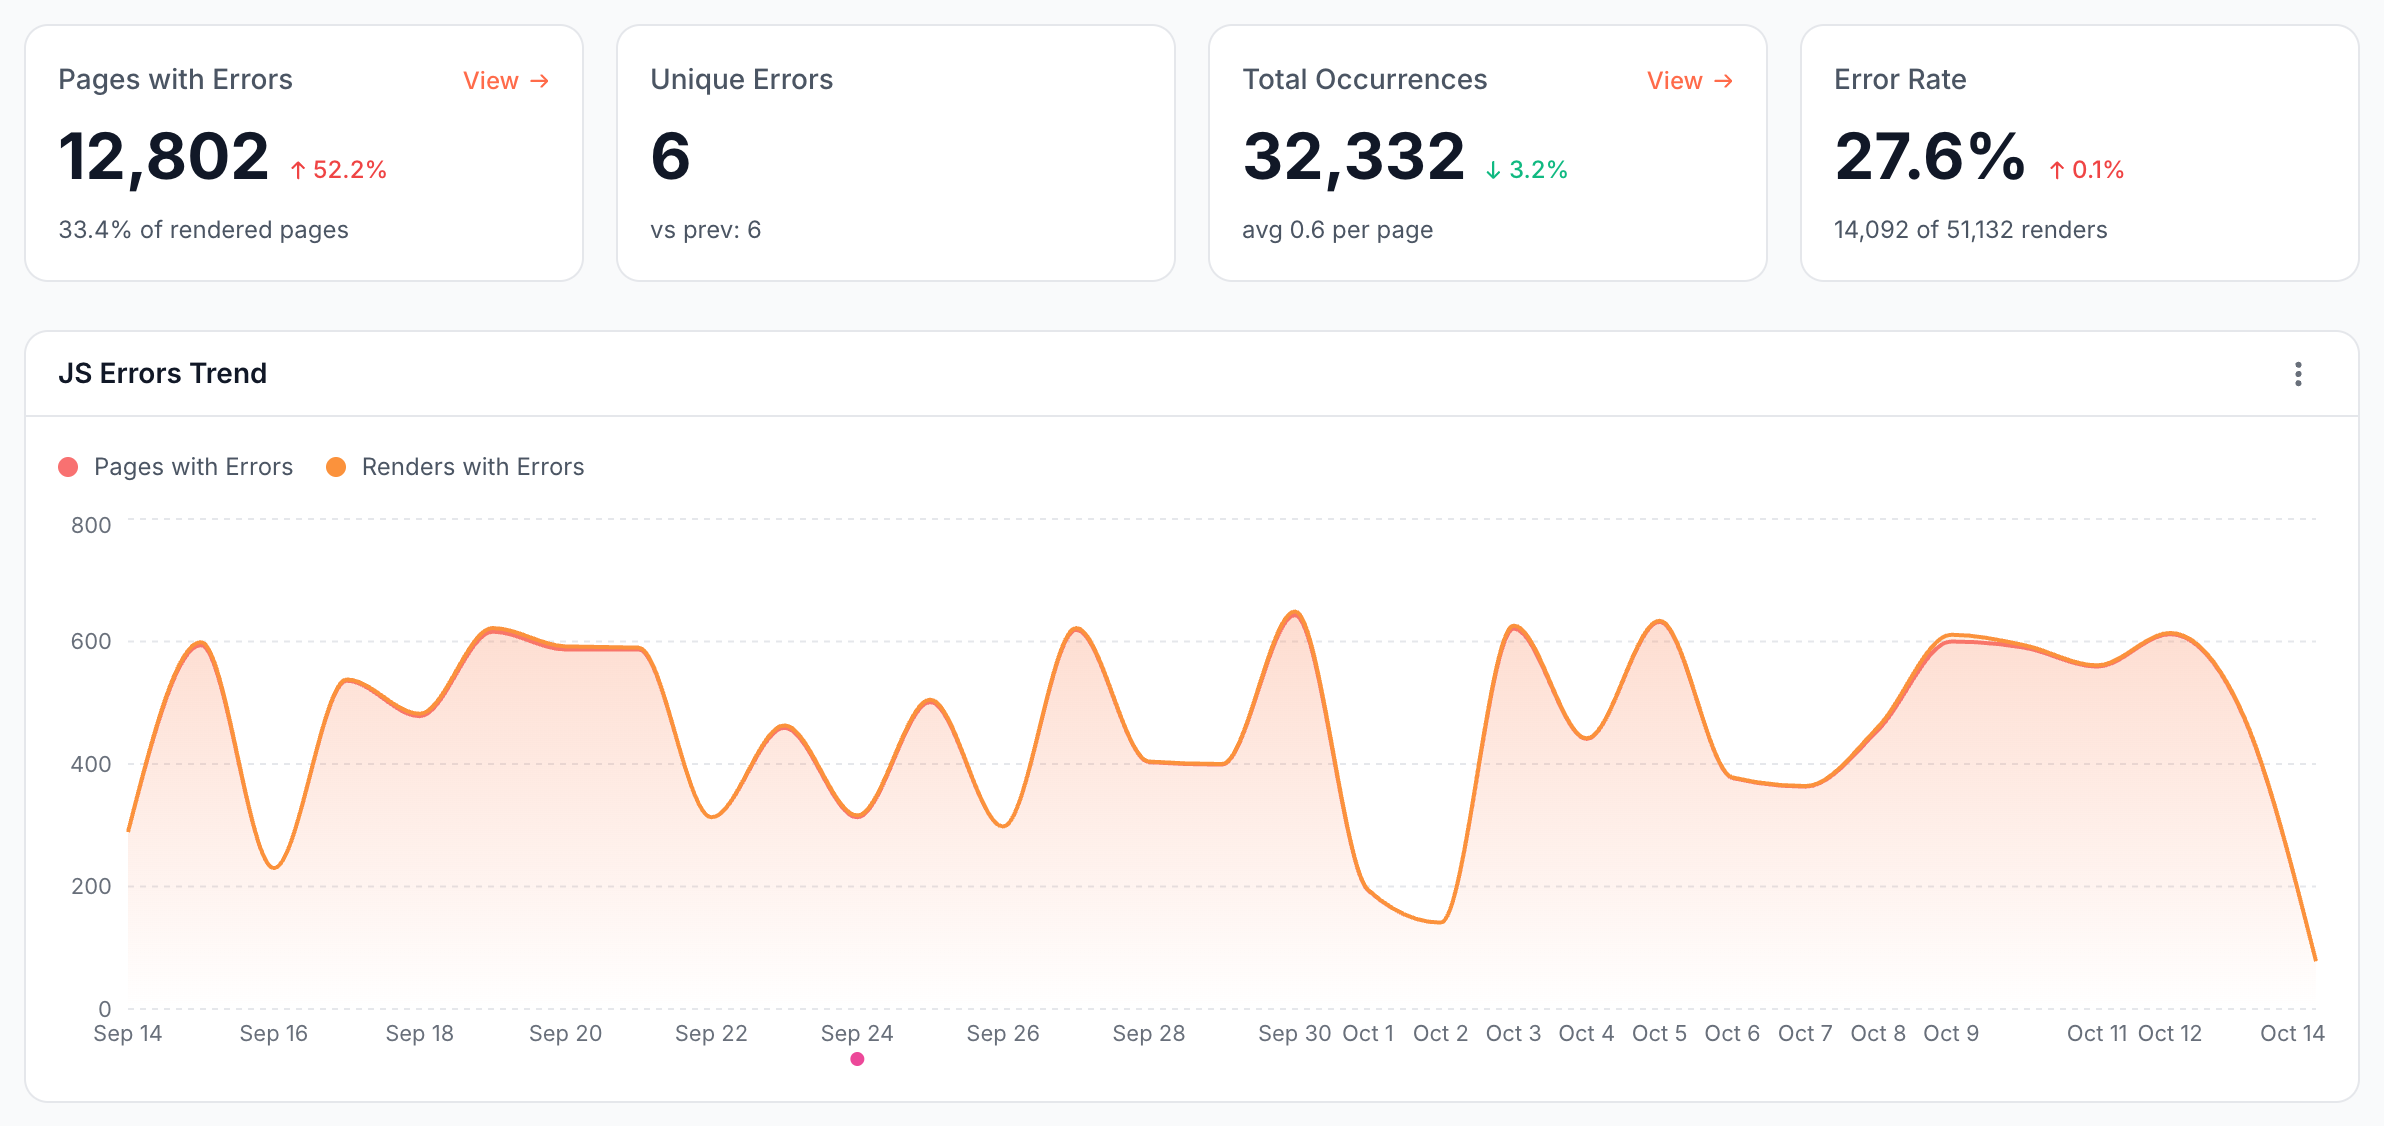
The tab collects the JavaScript console errors a page logs while EdgeComet renders it:
- Pages with Errors, Unique Errors, Total Occurrences and Error Rate, the share of renders with at least one error.
- JS Errors Trend: pages and renders with errors per day.
- Most Common Errors: the 10 most frequent messages, grouped by exact text, with the pages and renders they hit and when each was last seen. Expand a message to see three sample URLs.
Issues: what failed, and for which bots?
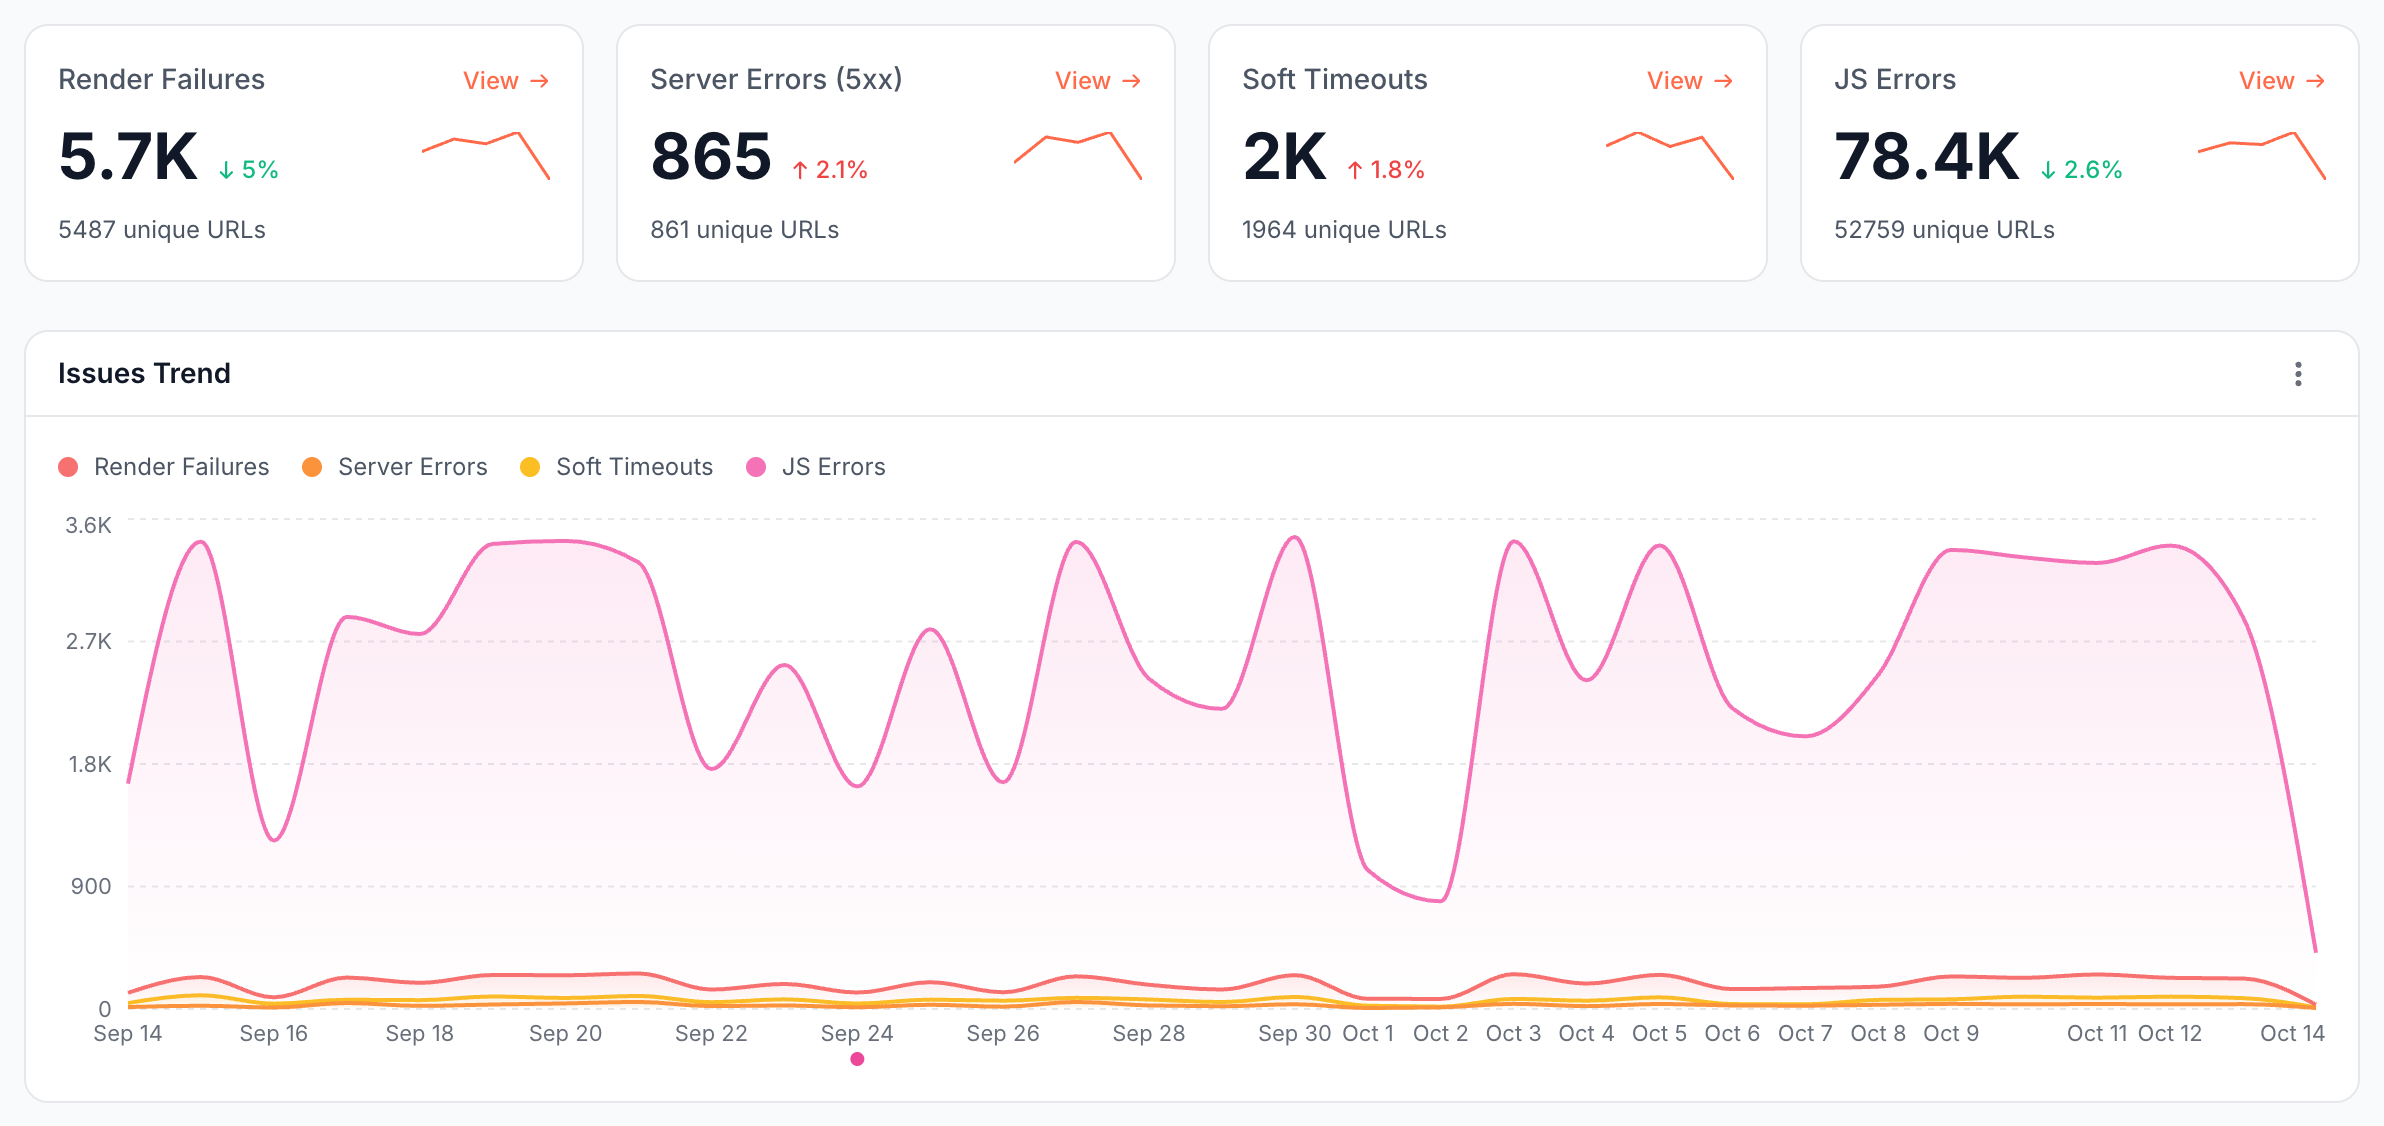
The Issues tab gathers every failure, including requests EdgeComet could not serve and pre-cache attempts that failed:
- Render Failures, Server Errors (5xx), Soft Timeouts and JS Errors, each with its unique URLs. A request can count in more than one card.
- Error Type Breakdown: each error type with its count, share and severity. See Error types and what they mean.
- Impact by Bot: the 10 bots that met the most issues.
- Third-Party Failures: domains whose requests failed during renders, such as a CDN, a font host or an ad network.
- Top JS Errors and Recent Issues, the 10 newest with their severity and URL.
How to read it
- A live render that fails still reaches the bot. EdgeComet answers it with the last cached copy or your server's HTML, and records the request as served. So most Failed Renders come from pre-cache renders and from your server answering
5xx, and they show which pages would fail the next time. - Render time is time a bot may wait. A bot waits for a render only when the page is not in the cache. Compare Avg Render Time with the Cache Performance share: a high cache share means few bots waited.
- Soft timeouts serve partial pages. A page that hits the Render Timeout before its wait event is captured as it was at that moment. Check those URLs in Page Analysis > Cache.
- Not every console error matters. An error from an analytics or chat script may not change the content. An error from your own app code often means a missing section.
What to do next
| You see | Do this |
|---|---|
| Many soft timeouts or renders over 5 seconds | Change the Wait For Event, block slow third-party requests, or raise the timeout for slow URLs with a URL rule |
| Failures on one third-party domain | Block it under Blocked AJAX URL Patterns if it adds no content |
| Server Errors (5xx) | Fix the pages on your server, then recache them |
| JS errors from your own code | Fix them in the app, or see Fix blank, partial or slow prerendered pages |
| Bots waiting for renders | Add pre-cache rules for the pages they request |
To be told when renders fail, slow down or come back empty, turn on the rendering alerts. See Rendering alerts.
Where to find it
In the dashboard: Cache > Renders, with the tabs Overview, Performance, JS Errors and Issues. For one URL, open Page Analysis.