

Analyze how Googlebot and Bingbot crawl your site
EdgeComet shows how Googlebot and Bingbot crawl your site in Log Analyzer > Googlebot and Log Analyzer > Bing. You see how many pages they request each day, which status codes they get, how fast they are served, and whether the pages they fetched are indexable.
Each report counts the search crawlers that index your pages: Googlebot desktop and mobile, or Bingbot desktop and mobile. These are the members of the Googlebot Search and Bingbot Search bot families. Requests from fake Googlebots and Bingbots are left out.
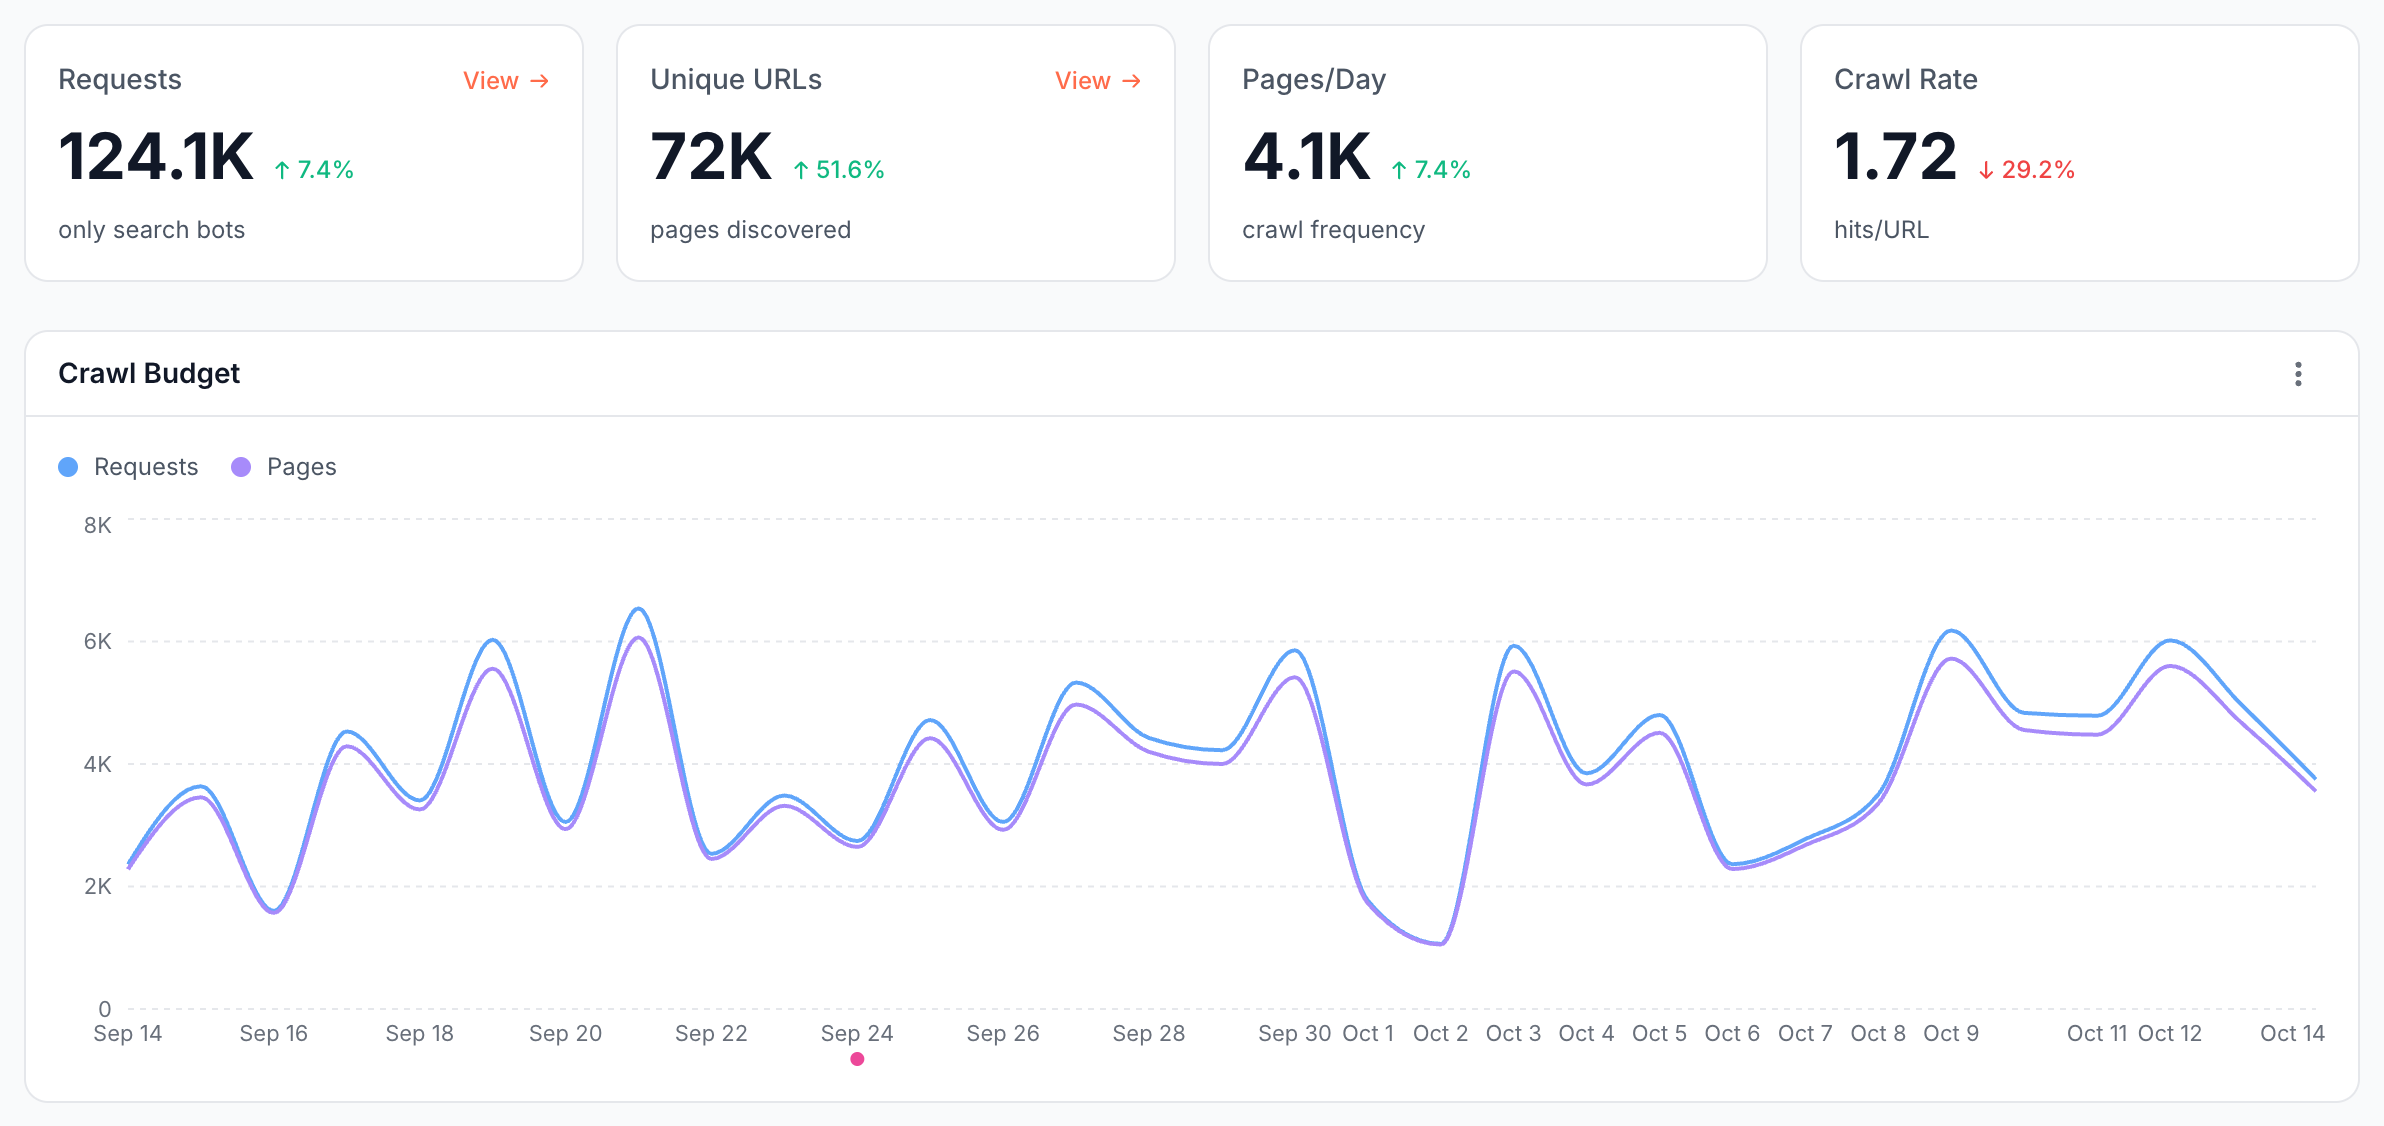
What the report shows
The Googlebot and Bing reports have the same three tabs: Crawl Budget for crawl volume and speed, Efficiency for wasted crawl, and Indexability for the state of the pages the bot fetched.
How much do Googlebot and Bingbot crawl?
The Crawl Budget tab shows how much the bot crawled in the period, which is the crawl it spent, not a limit Google sets. See What Google means by crawl budget.
| Card or panel | What it shows |
|---|---|
| Requests | Requests from the search crawlers |
| Unique URLs | Distinct pages they requested. See How unique URLs are counted |
| Pages/Day | Requests divided by the number of days in the period. Despite the label, it counts requests, not distinct pages |
| Crawl Rate | Requests per distinct page. See Crawl rate |
| Crawl Budget | Requests and distinct pages per day. A page fetched on several days counts on each, so the daily pages add up to more than Unique URLs |
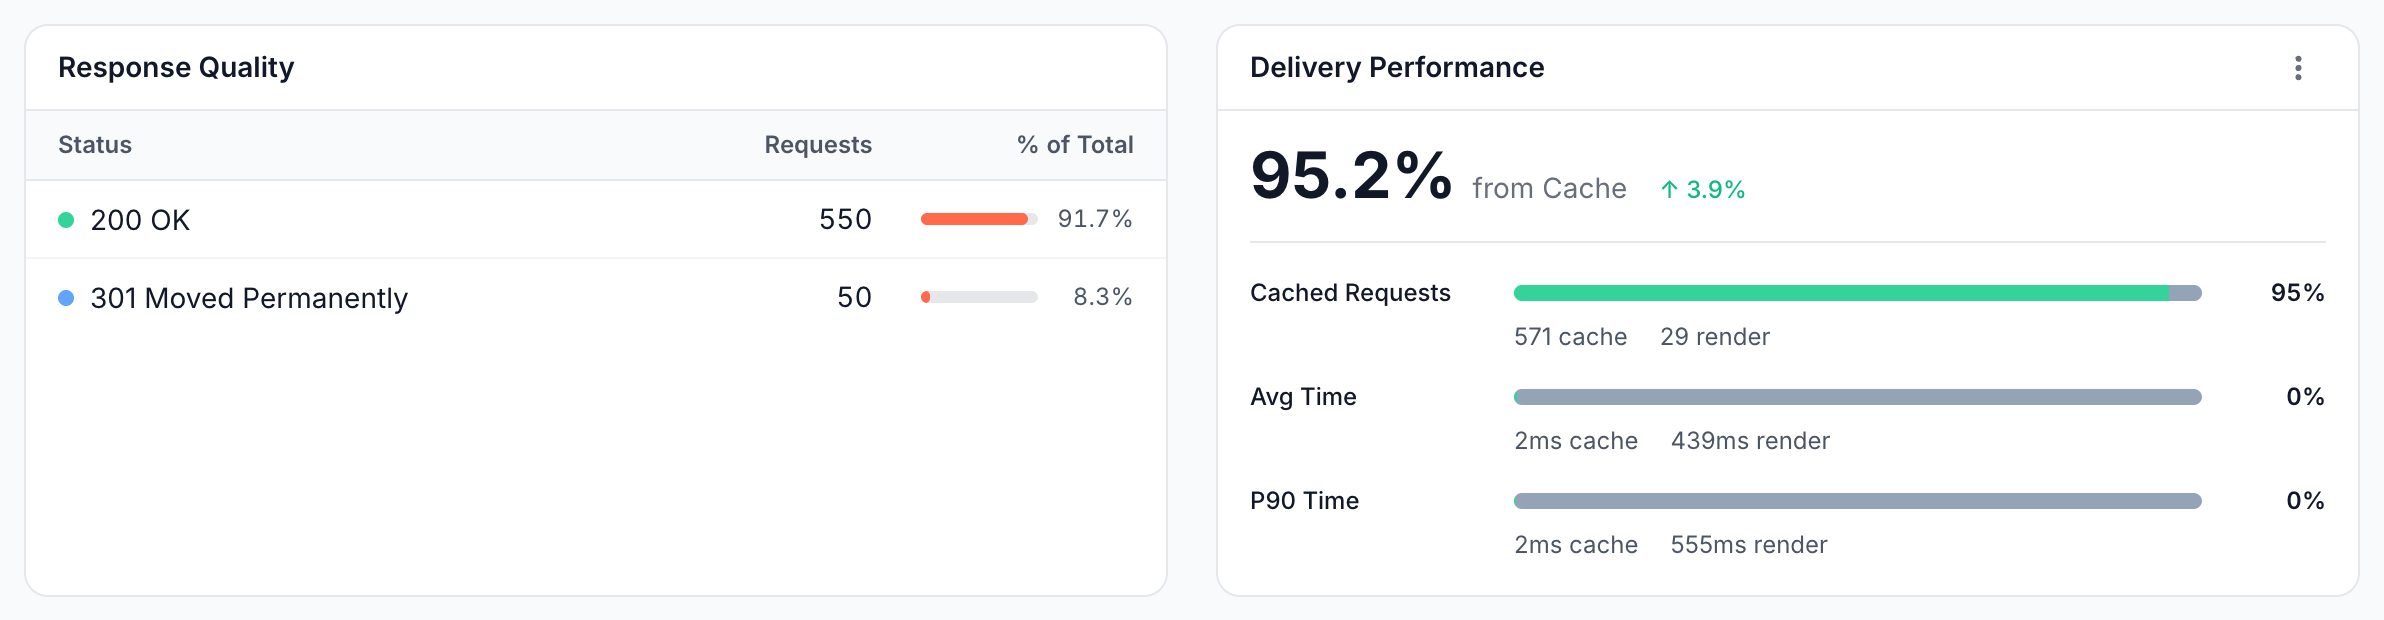
| Response Quality | Every status code the bot received, with requests and % of Total |
| Indexability Status and Cache Performance | The Overview tab panels for this bot only |
| Segment Performance | Per segment: share of crawl, requests, unique URLs, average serve time, 4xx and 5xx |
Crawl rate: how often Googlebot fetches each page
Crawl rate in EdgeComet is the average number of times the bot requested each page in the period: Requests divided by Unique URLs. It is a ratio, not a crawl speed. A crawl rate of 1.72 over 30 days means Googlebot fetched each page it visited 1.72 times on average.
The average hides the spread: the home page can be fetched many times a day while other pages are fetched once.
Delivery performance: how fast Googlebot and Bingbot are served
Delivery performance shows how much of the bot's crawl EdgeComet answered from its cache and how fast.
The Delivery Performance card opens with the share served from Cache: requests served from the cache (Cache Hit and Bypass Cache) divided by those plus Render and Bypass requests. This share can differ from the Cache Performance panel, which shows Bypass as a bar of its own.
Below the share, Cached Requests, Avg Time and P90 Time compare cache and render side by side, in serve time. A cache hit is served in under 15 ms, while a render waits for the page to load in a browser.
For how response speed affects Google's crawling, see Server speed and the crawl capacity limit.
Bot variants: the Google and Bing crawlers in one table
Bot variants are the crawlers of one search engine that the Bot Variants table on the Crawl Budget tab lists, one per row. The rest of the report counts only the search crawlers, so this table is where the other fetchers appear:
- Googlebot: Googlebot Mobile, Googlebot Desktop, Googlebot Image, Googlebot News and Google AdsBot.
- Bing: Bingbot Desktop, Bingbot Mobile and Bing Preview.
For each variant the table shows % of Total, Requests, Failed Requests, Unique URLs and Avg Time, with change against the previous period. A variant that did not visit is listed with zero. Other Google and Bing bots, such as GoogleOther, are listed in Search crawler user agents.
How much of the Googlebot and Bingbot crawl is wasted?
The Efficiency tab sorts the bot's requests into valuable, questionable and wasted, and lists the URLs it found, lost or crawled too often. See Crawl efficiency.
Are the pages Googlebot and Bingbot fetched indexable?
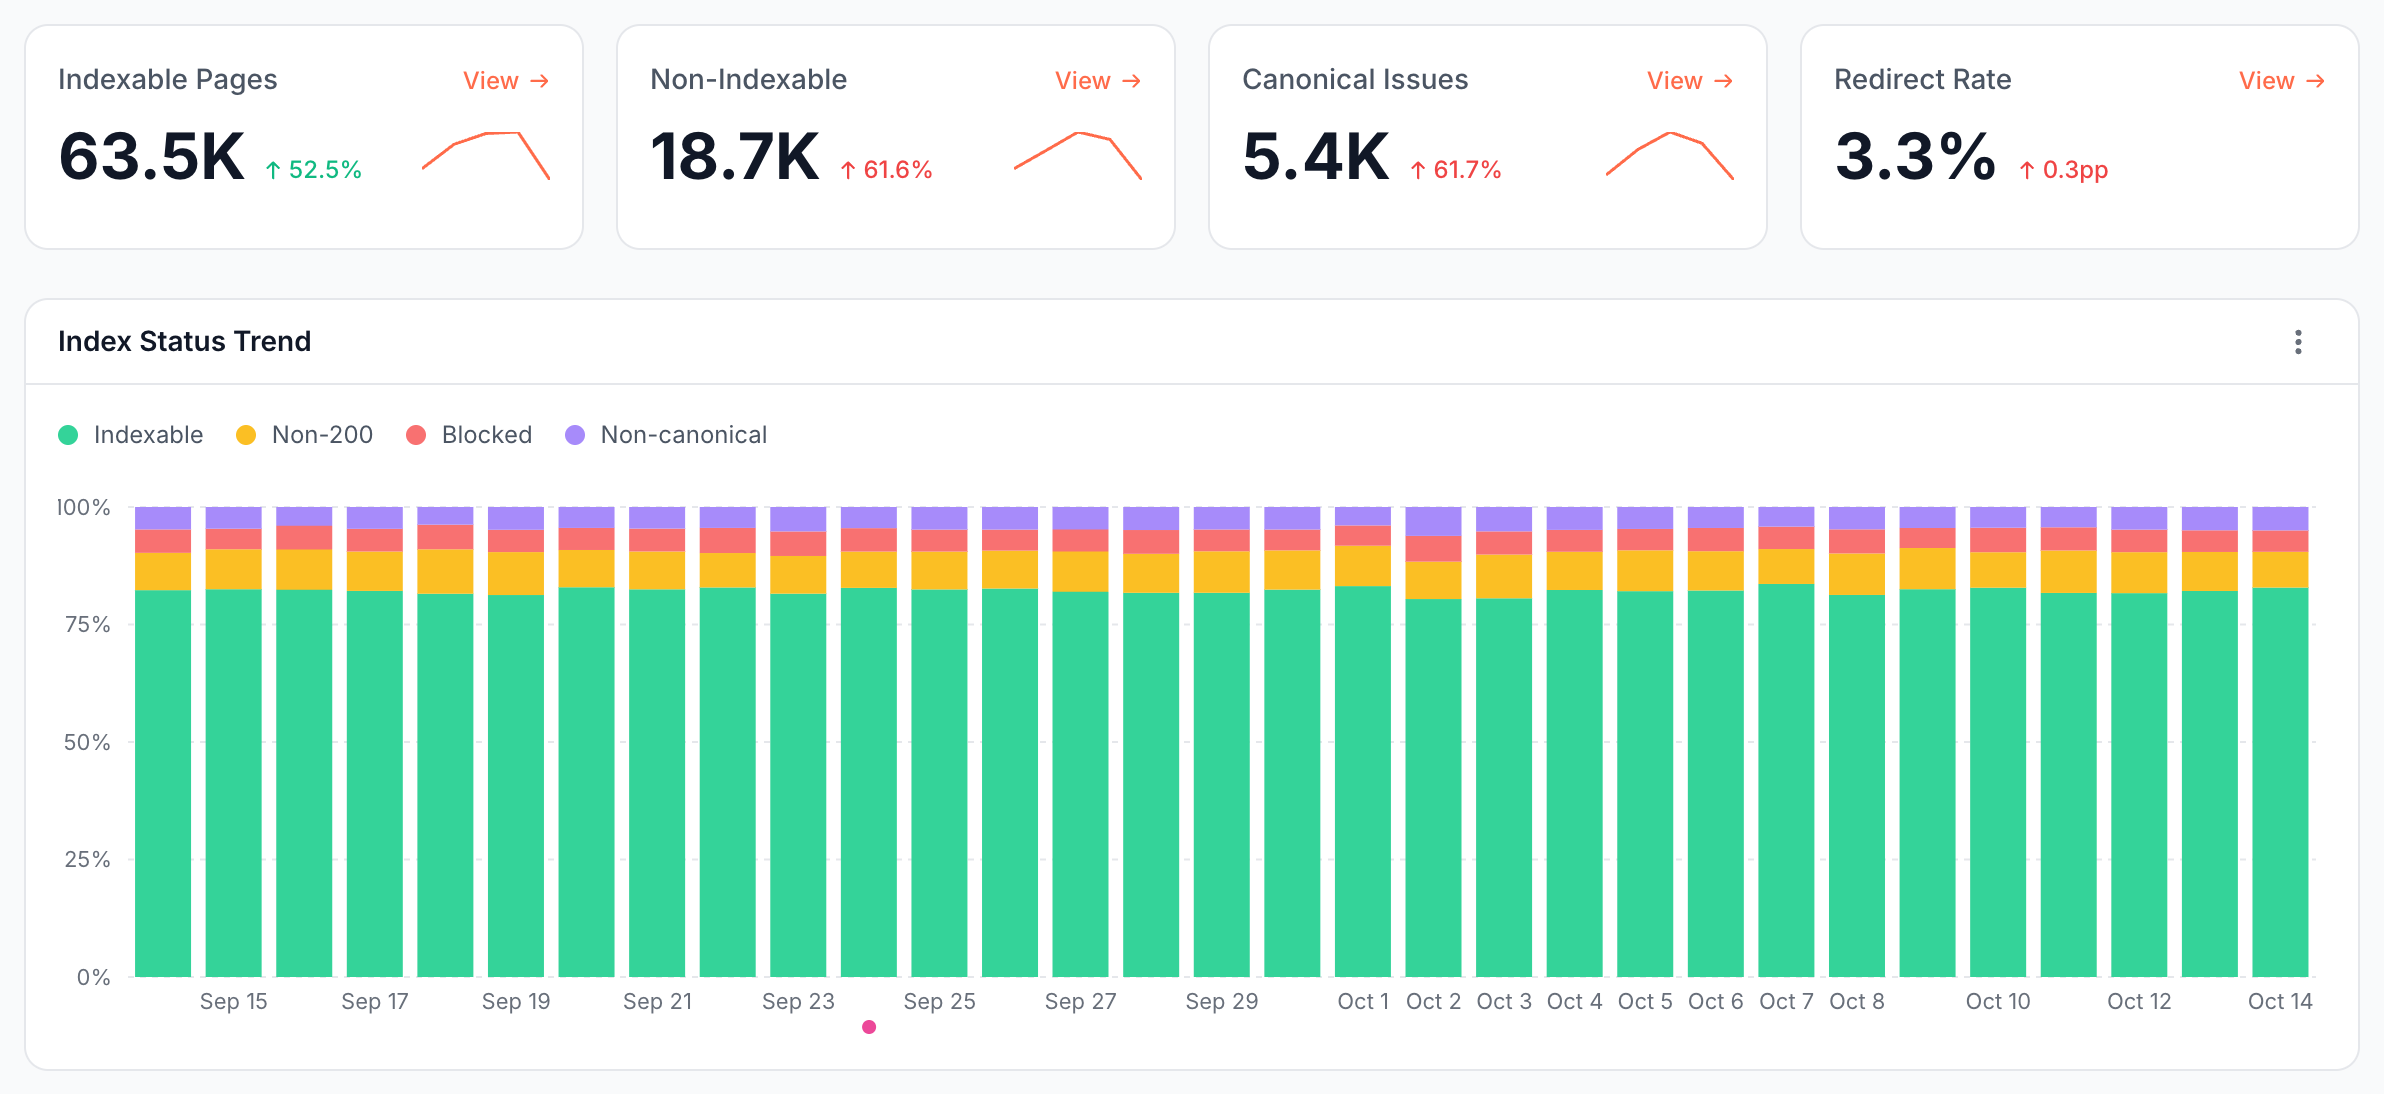
The Indexability tab counts distinct pages the bot fetched, by indexability:
- Indexable Pages and Non-Indexable: pages in each state. A page whose state changed during the period counts in each state it held, so Indexable Pages plus Non-Indexable can be more than the pages fetched.
- Canonical Issues: non-indexable pages whose canonical tag points to another URL.
- Redirect Rate: the share of fetched URLs that answered with a redirect.
- Index Status Trend and Index Status Distribution: pages that were Indexable, Non-200, Blocked by a
noindexrobots meta tag, or Non-canonical, per day and for the period. - Meta Robots Directives, Canonical Analysis and Hreflang Coverage: the robots directives, canonical tags and hreflang languages of the pages served to the bot with a
200, read from each page's latest snapshot. (not parsed) and Not parsed mean EdgeComet has no snapshot of the page to read: missing data, not a directive. - Redirect Status Codes and Top Redirect Patterns: the
3xxcodes returned, and the five path patterns, such as/product/*, with the most redirecting URLs.
View on a stat card opens the pages behind it in Data Explorer.
This tab counts what one bot was served over the period. For one verdict per page across every bot's visits, with the demand on each bucket, see Find pages Google cannot index.
How this compares with the Search Console Crawl Stats report
The Search Console Crawl Stats report and EdgeComet's Googlebot report answer different questions, and you can use both. Google's Crawl Stats report help page describes a summary of Google's crawler requests to your domain, images and scripts included. EdgeComet records each page request it served to Googlebot, with the page Googlebot received.
| Search Console Crawl Stats | EdgeComet Googlebot report | |
|---|---|---|
| What it covers | Requests from Google's crawlers to the property, by response, file type, purpose and Googlebot type, plus host status | Requests from verified Googlebot desktop and mobile that your routing sends to EdgeComet, usually your HTML pages. Other Google crawlers are in Bot Variants |
| Per-URL detail | Example URLs that Google calls "not comprehensive, but just a representative example" | Each request, with its URL, time, status code and serve time, in Data Explorer > Bot log |
| Page state | Not in this report | Indexability, canonical, robots directives and hreflang of the page as Googlebot received it |
| Sections of your site | By host, on domain properties | By segment, such as product pages, on every card and in Segment Performance |
| Completeness | Google says it "reports most crawl requests, but some requests might not be counted" | Each request EdgeComet served to these crawlers |
| Other search engines | Google only | The same report for Bingbot |
In Search Console, Crawl Stats is under Settings > Crawl stats. Requests your routing sends straight to your server, usually images, scripts and stylesheets, never reach EdgeComet. See What EdgeComet can and cannot see. Use Crawl Stats for those requests and for Google's host status checks.
How to read it
These changes on the Googlebot and Bing reports point to a crawl problem:
- Pages/Day falls while your site stays the same size. Google may be crawling less. Check Response Quality for
5xxand429responses, and Delivery Performance for slow renders. See Server speed and the crawl capacity limit. - Crawl concentrates on low-value sections. In Segment Performance, a segment like parameter URLs or internal search taking a large share of the crawl points to crawl waste. Open the Efficiency tab.
- Crawl Rate rises. Requests grew faster than Unique URLs, or Unique URLs fell. If requests grew, a few URLs, such as feeds or the home page, may be taking much of the crawl.
- Non-Indexable grows. Googlebot is spending crawl on pages that, as served, are not indexable. View on Non-Indexable lists them.
- The share from cache drops. More requests wait for a render or for your server. Pre-cache rules render pages before bots ask, so more requests are cache hits.
What to do next
Most findings on these reports lead to one of these fixes:
- Cut wasted crawl. See which URLs waste crawl in Crawl efficiency, and what EdgeComet counts as waste in Crawl budget and crawl waste explained.
- Fix non-indexable pages you want indexed. Open the pages from Non-Indexable or Canonical Issues, then fix the robots meta tag or canonical in your CMS, or rewrite it with an Edge SEO robots rule or canonical rule.
- Point links at final URLs. For URLs in Top Redirect Patterns, update internal links and sitemaps to the redirect target, so bots stop requesting the old address.
- Fix server errors. For
5xxresponses in Response Quality, click the count to list the URLs and their times in Data Explorer. - Check a fake Googlebot. Requests that claimed to be Googlebot from outside Google's IP ranges are in Bad Bots.
Where to find it
In the dashboard: Log Analyzer > Googlebot or Log Analyzer > Bing, with the tabs Crawl Budget, Efficiency and Indexability. On the Googlebot report, the Crawl Budget tab is titled Googlebot Insights and the Indexability tab Googlebot Indexability.
Related Articles
- Log File Analysis for SEO: A Practical Guide for 2027
- Evergreen Crawl: A New Way to See Your Site Through Googlebot’s Eyes
- Crawl Rate vs Crawl Budget: What to Monitor and How to Optimize
- Log File Analysis in the Age of AI Bots
- how Googlebot renders JavaScript content
- Can Google Analytics Detect Bot Traffic? Why Server Logs Tell a Different Story