

Annotations: mark releases and events on charts
An annotation is a dated note on EdgeComet report charts, such as a release, a migration or a Google update. It shows as a dot under the date axis of the report charts that cover its date, for everyone who can open the website. See Which charts show annotations. Also called a chart note.
Annotations come from three sources: your team, Google ranking updates and EdgeComet itself. Your team's notes are also listed under Configuration > Annotations.
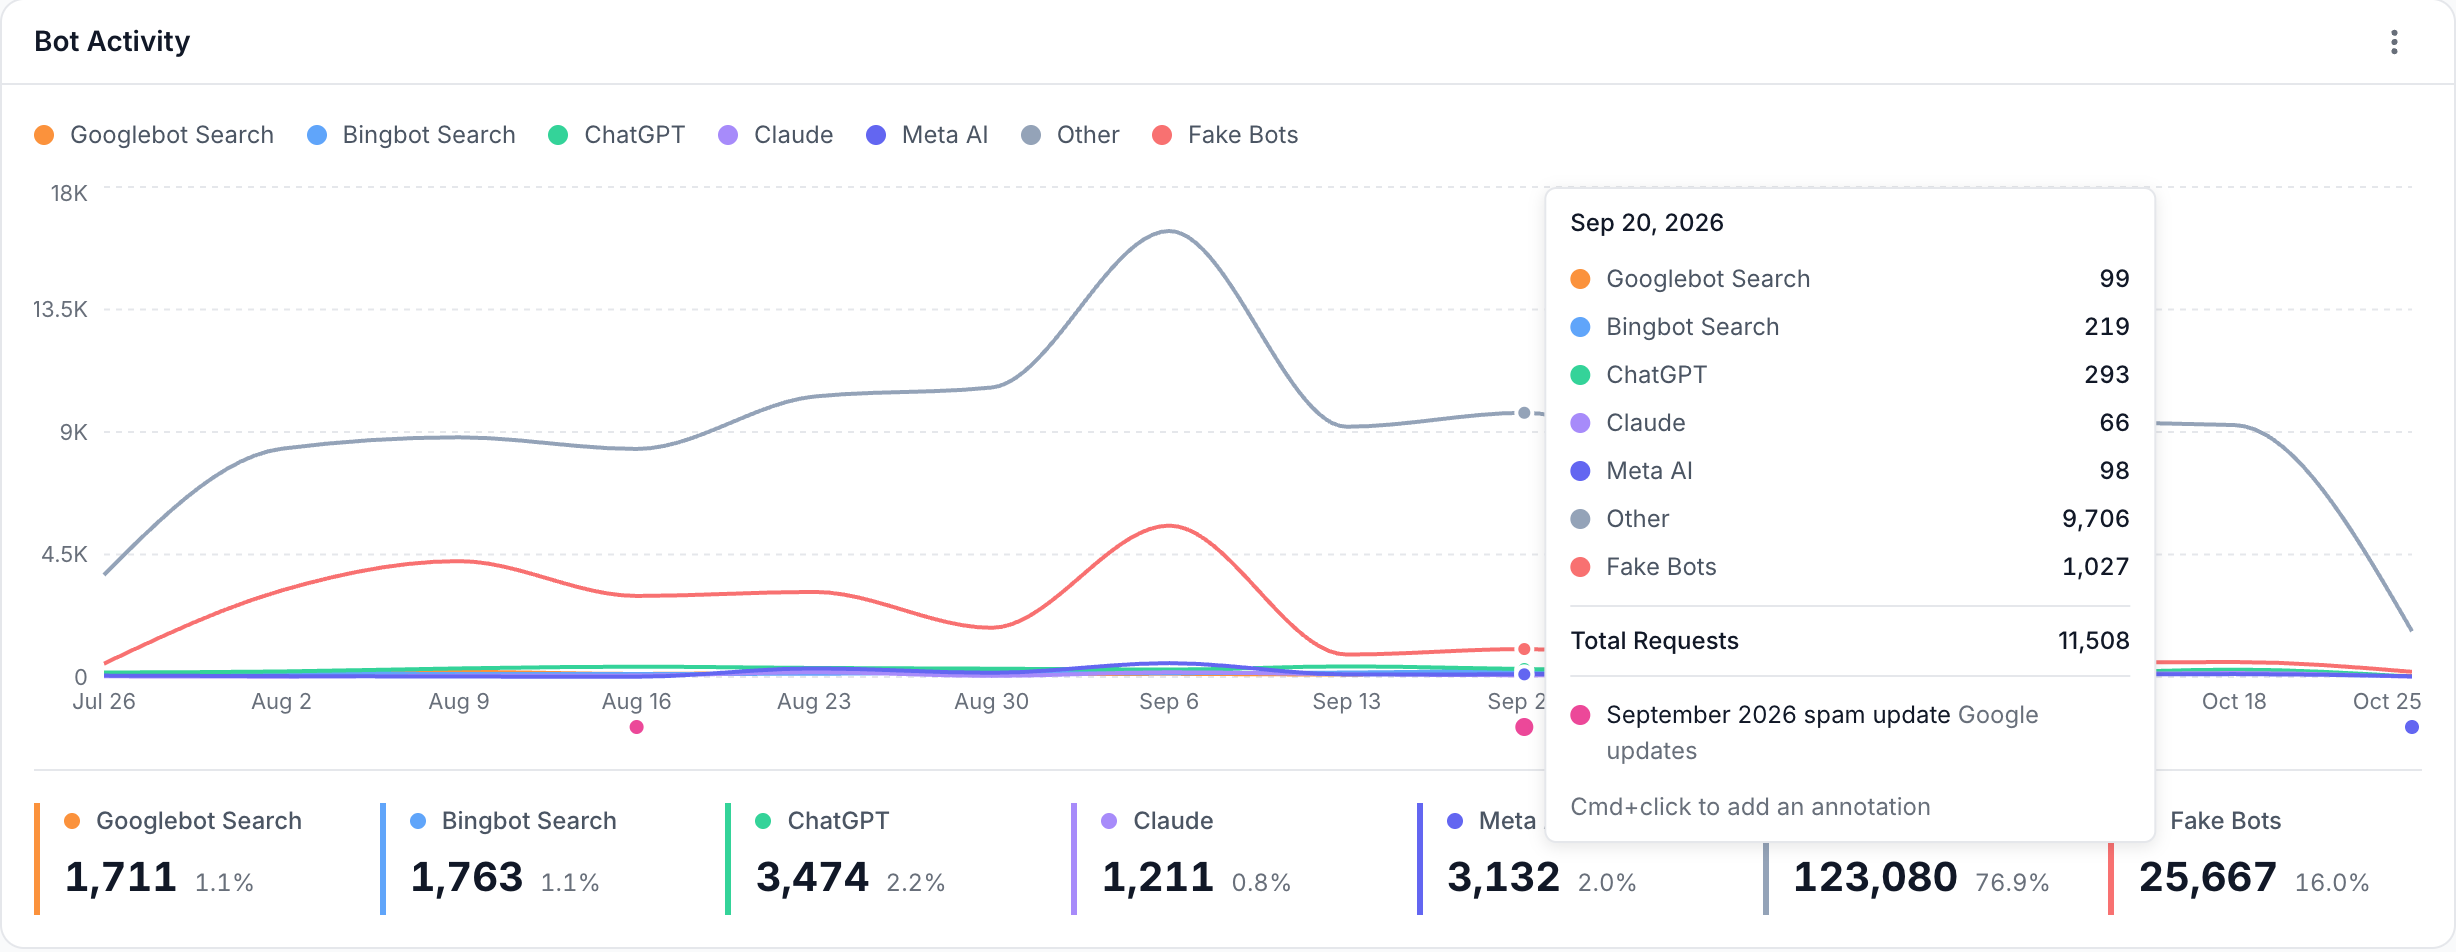
What the dots on a chart show
Each dot marks a day with one or more annotations. Its color says where the note comes from:
- Indigo: a note from your team.
- Pink: a Google ranking update. See Google ranking updates.
- Red: an EdgeComet note, such as the day EdgeComet was installed or a site release. See EdgeComet notes.
Hover the day to read its notes in the chart tooltip, each with its colored dot. Google and EdgeComet notes end with their source, such as Google updates, EdgeComet or Site releases. The tooltip lists up to 5 notes, then "{N} more".
When several notes share a day, a number next to the dot counts them, and the dot takes your team's color first, then EdgeComet's, then Google's. A weekly or monthly chart puts a note on the week or month that contains it, and an hourly chart on the first hour of its day.
Add an annotation from a chart
- Open a report with a date chart, such as Log Analyzer > Overview.
- Cmd+click the day in the chart on a Mac, or Ctrl+click it on Windows and Linux. A right-click works too.
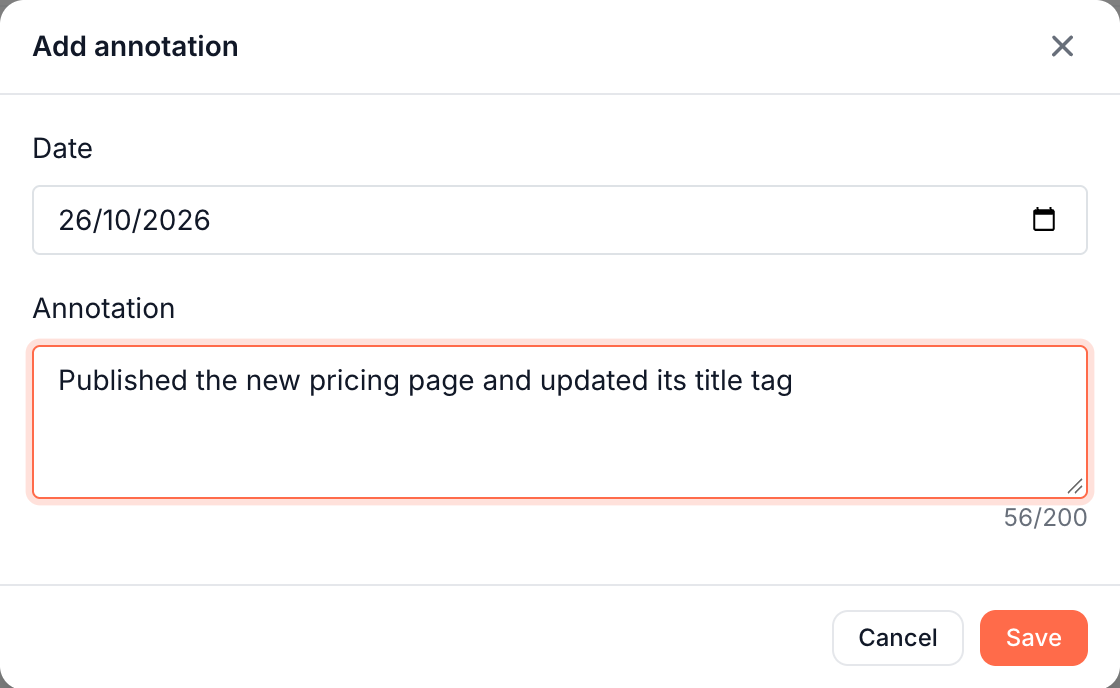
- In Add annotation, check the Date, which is the day you clicked, and type the note in Annotation. The counter under the box shows the characters used, up to 200.
- Click Save, or press Cmd+Enter on a Mac or Ctrl+Enter on Windows and Linux.
Click inside the plot area: a click on the axis labels does nothing. On a Mac, Ctrl+click opens the browser menu and adds nothing: use Cmd+click or a right-click. On charts where a plain click opens Data Explorer, Cmd+click adds an annotation instead.
The tooltip reminds you of the gesture: "Cmd+click to add an annotation", or "Click the dot to edit, Cmd+click to add" on a day that already holds one of your team's notes. On Windows and Linux it reads Ctrl.
Edit or delete an annotation
Click a dot that holds one of your team's notes. One note opens Edit annotation. Several notes open a list titled "Annotations on {date}" to pick from.
- Change the Date or the text.
- Click Save.
To delete the note, click Delete in Edit annotation, then confirm "Delete annotation?". The dialog reads "The annotation on {date} will be removed from all charts", followed by the note.
Anyone who can edit annotations can change or delete every team note on the website, not only their own. Dots that hold only Google or EdgeComet notes do not open the editor.
Manage your team's annotations in one list
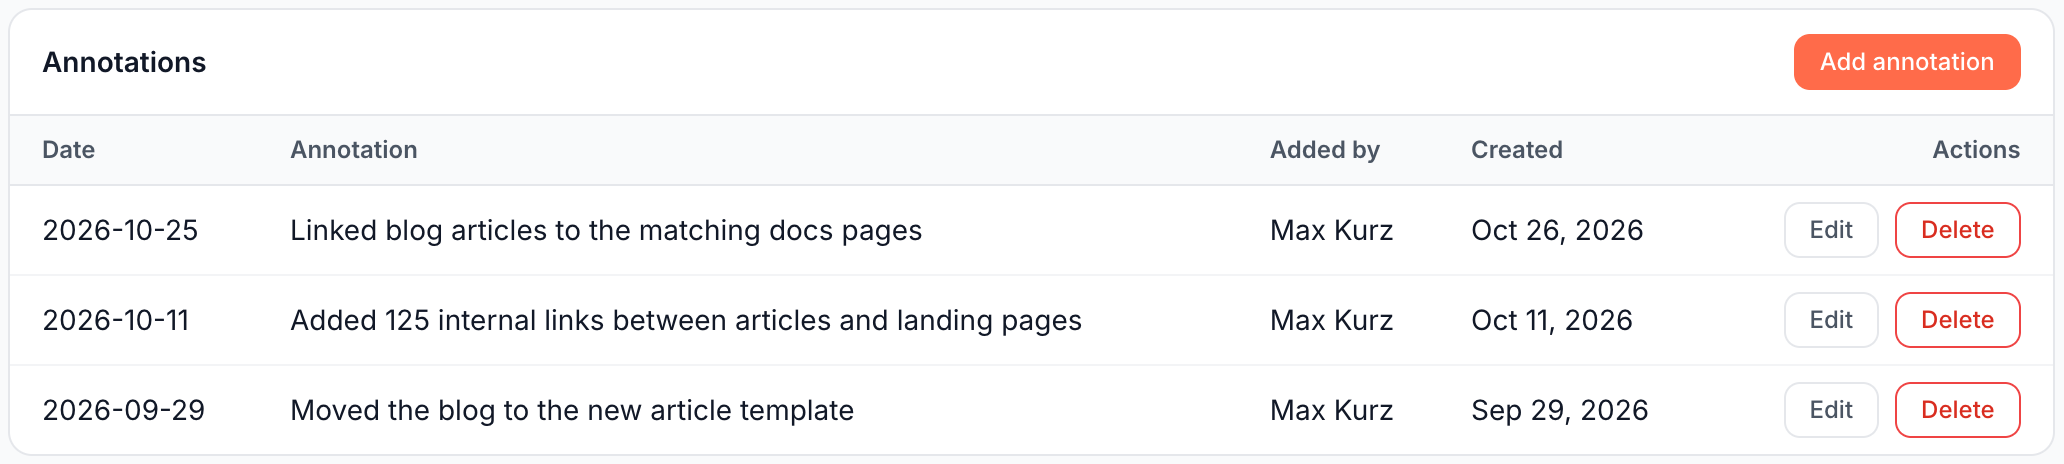
Configuration > Annotations lists your team's notes, newest date first:
- Date: the day of the note, as YYYY-MM-DD.
- Annotation: the text. Hover a long note to read all of it.
- Added by: the teammate who wrote it.
- Created: when it was added, such as Oct 11, 2026.
- Actions: Edit and Delete, which open the same dialogs as on a chart.
Add annotation above the table opens the dialog with today's date. With no notes, the table reads "No annotations yet". Google and EdgeComet notes show on charts only.
Google ranking updates
EdgeComet marks Google's ranking updates, such as core and spam updates, on the charts of every website. It reads them every day from the Google Search Status Dashboard and dates each one on the day its rollout started, in UTC. The history goes back to November 2021.
A Google update helps you tell a site change from a search change. A traffic move in the week of a core update has a second possible cause besides your own release.
EdgeComet notes
EdgeComet adds red notes for events on your website:
- "EdgeComet installed": the day EdgeComet confirmed the install, when the Cloudflare install finished or the install check ran. A site with neither gets it on the day of its first verified bot visit. See Check the integration.
- "Release: {name}": each site release EdgeComet detects, on the release day. Renaming the release renames the note.
The tooltip labels them EdgeComet and Site releases. Notes from the EdgeComet team, which show on every website, usually carry the EdgeComet label.
Annotations in chart exports
The chart's ⋮ menu offers Export, which saves the chart as a PNG. Show annotations, on by default, adds a dashed line and a numbered pin for each annotated day, with the numbered notes under the chart. Notes on the same day are joined with semicolons.
Clear Show annotations to export the chart without them. See Chart export in Periods, comparisons and filters.
Which charts show annotations
Annotations show on the date charts of these reports:
- Overview
- Log Analyzer: Overview with its Status Codes, Loading Time and Page Size tabs, Googlebot, Bing, AI Bots and Bad Bots
- Cache: Overview and Renders, with its Performance, JS Errors and Issues tabs
- Changes: the Timeline of the Overview tab
- Search: Overview, Traffic Decay and Cannibalization
- Page Analysis: bot visits, status codes, serve time, render time, page size, JS errors and Search Console performance
- Custom reports shown as a line chart
Page Analysis also draws violet lines for SEO changes on the page, which are not annotations. See SEO changes on the search chart.
If it does not work
You cannot add annotations
No Add annotation button and no response to Cmd+click mean your role cannot change annotations: adding, editing and deleting them needs the Manager role or higher. Read-only members see annotations on charts and on Configuration > Annotations, without Add annotation, the Actions column or the tooltip hint. See Team roles and permissions.
A note does not show on a chart
A chart shows only the notes inside its period. Widen the period, or check the note's date under Configuration > Annotations.
"Could not save the annotation"
The save request failed, for example after a lost connection or a server error. The dialog keeps your text: click Save again, or reload the page if the message stays.
Where to find it
In the dashboard: the dots under the date axis of report charts, and Configuration > Annotations for your team's notes.