

Monitor cache hit rate and cached URLs
How much of your bot traffic does EdgeComet answer from its cache, and did pre-cache get there before the bots? Cache > Overview answers the first question per bot group, and Cache > Precache > Statistic answers the second.
The cache hit rate is the share of bot requests EdgeComet answered with a cached copy, from the render cache or the bypass cache, out of all the bot requests it served. A high rate means bots get pages in under 15 ms and rarely reach your server.
What the report shows
Cache > Overview shows how the cache served bots over the period you pick. Cache > Precache > Statistic shows what pre-cache did over the last 30 days.
Is the cache answering bot traffic?
The four cards at the top of Cache > Overview count bot requests the cache answered, with the change against the previous period:
| Card | Value | Footer |
|---|---|---|
| Requests Avoided | Requests answered from the cache, so no render and no request to your server | "% of eligible requests": cached responses out of cached responses plus live renders. Requests that bypass rendering without the bypass cache are left out |
| Bandwidth Saved | HTML served from the cache | Average size per cached response |
| Avg Response | Average serve time of cached responses | On a website that renders: "vs" the average render time |
| URLs Cached | Distinct URLs served from the cache | "% of total pages": cached URLs out of the distinct URLs served from the cache or rendered |
Requests Avoided and URLs Cached have a View link that lists the requests or URLs behind the number in Data Explorer.
Which bots get cached pages?
- Cache Hit Rate Trend draws the cache hit rate over time for four groups: Googlebot Search (Googlebot desktop and mobile), AI Bots, Monitoring Bots and The Rest, which holds every other bot, Bingbot included. A gap in a line means that group made no requests in that interval. Click a point to list the cache hits behind it.
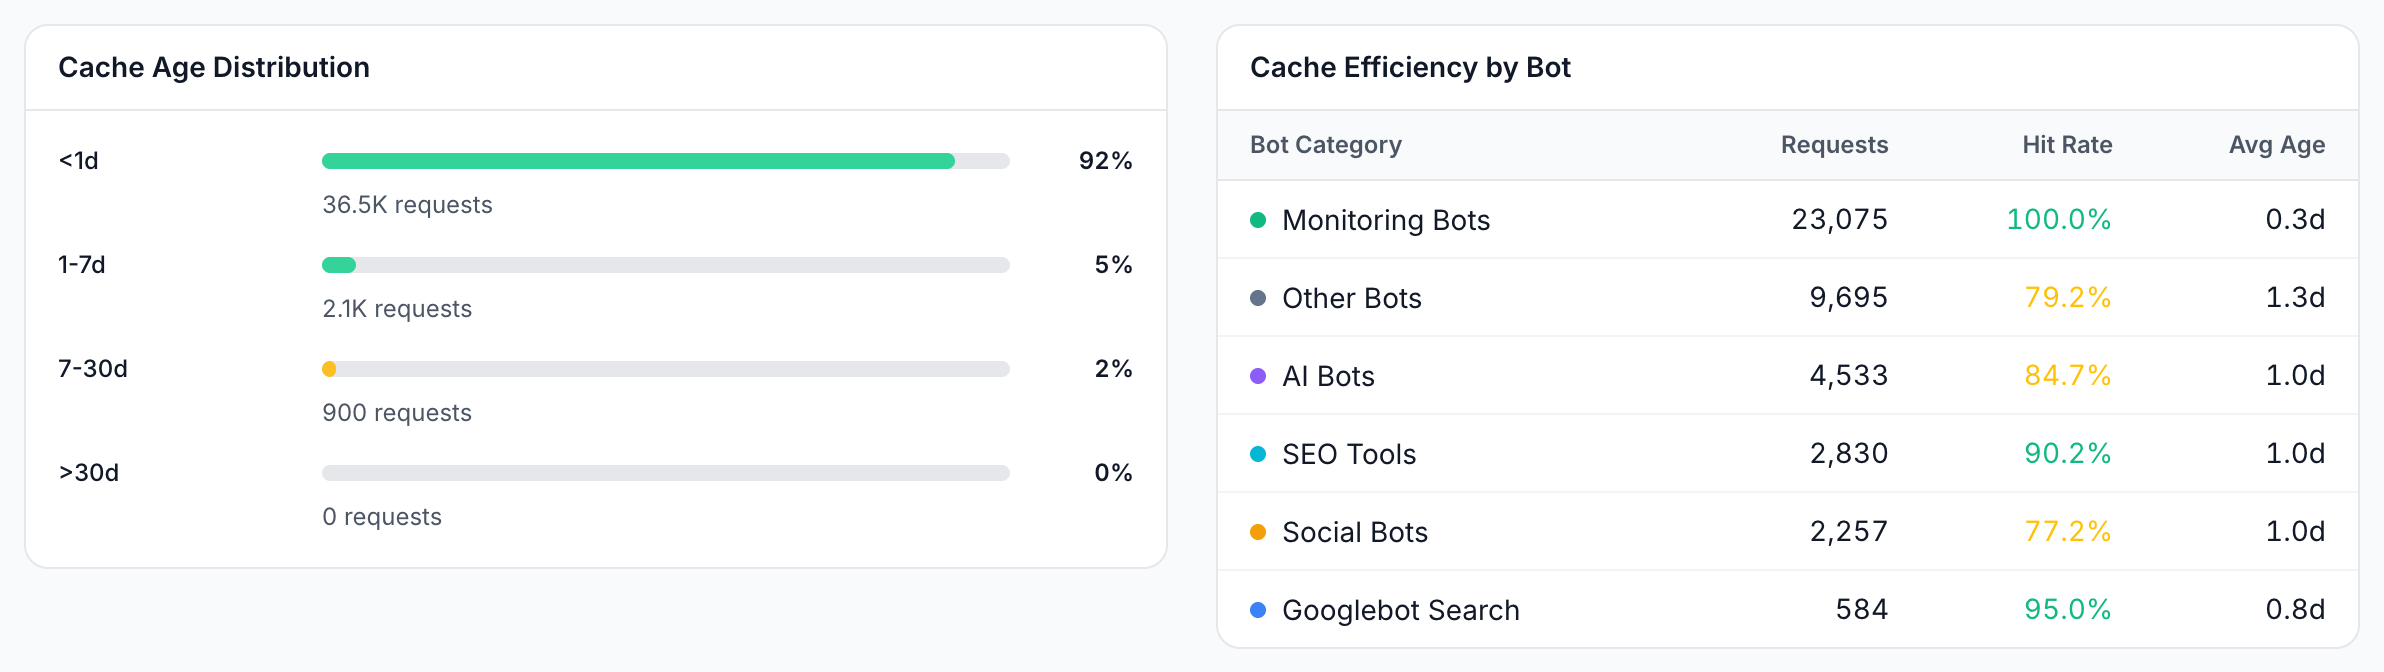
- Cache Efficiency by Bot gives each bot category its Requests, Hit Rate and Avg Age in days. A hit rate of 85% or more is green, 70% or more is amber, and lower is red.
How old are the copies bots get?
Cache Age Distribution splits cached responses by the age of the copy when it was served: <1d, 1-7d, 7-30d and >30d. It counts requests, not URLs, so a page bots request often weighs more.
Is pre-cache working?
Cache > Precache > Statistic covers the last 30 days. Its figures update within 15 minutes.
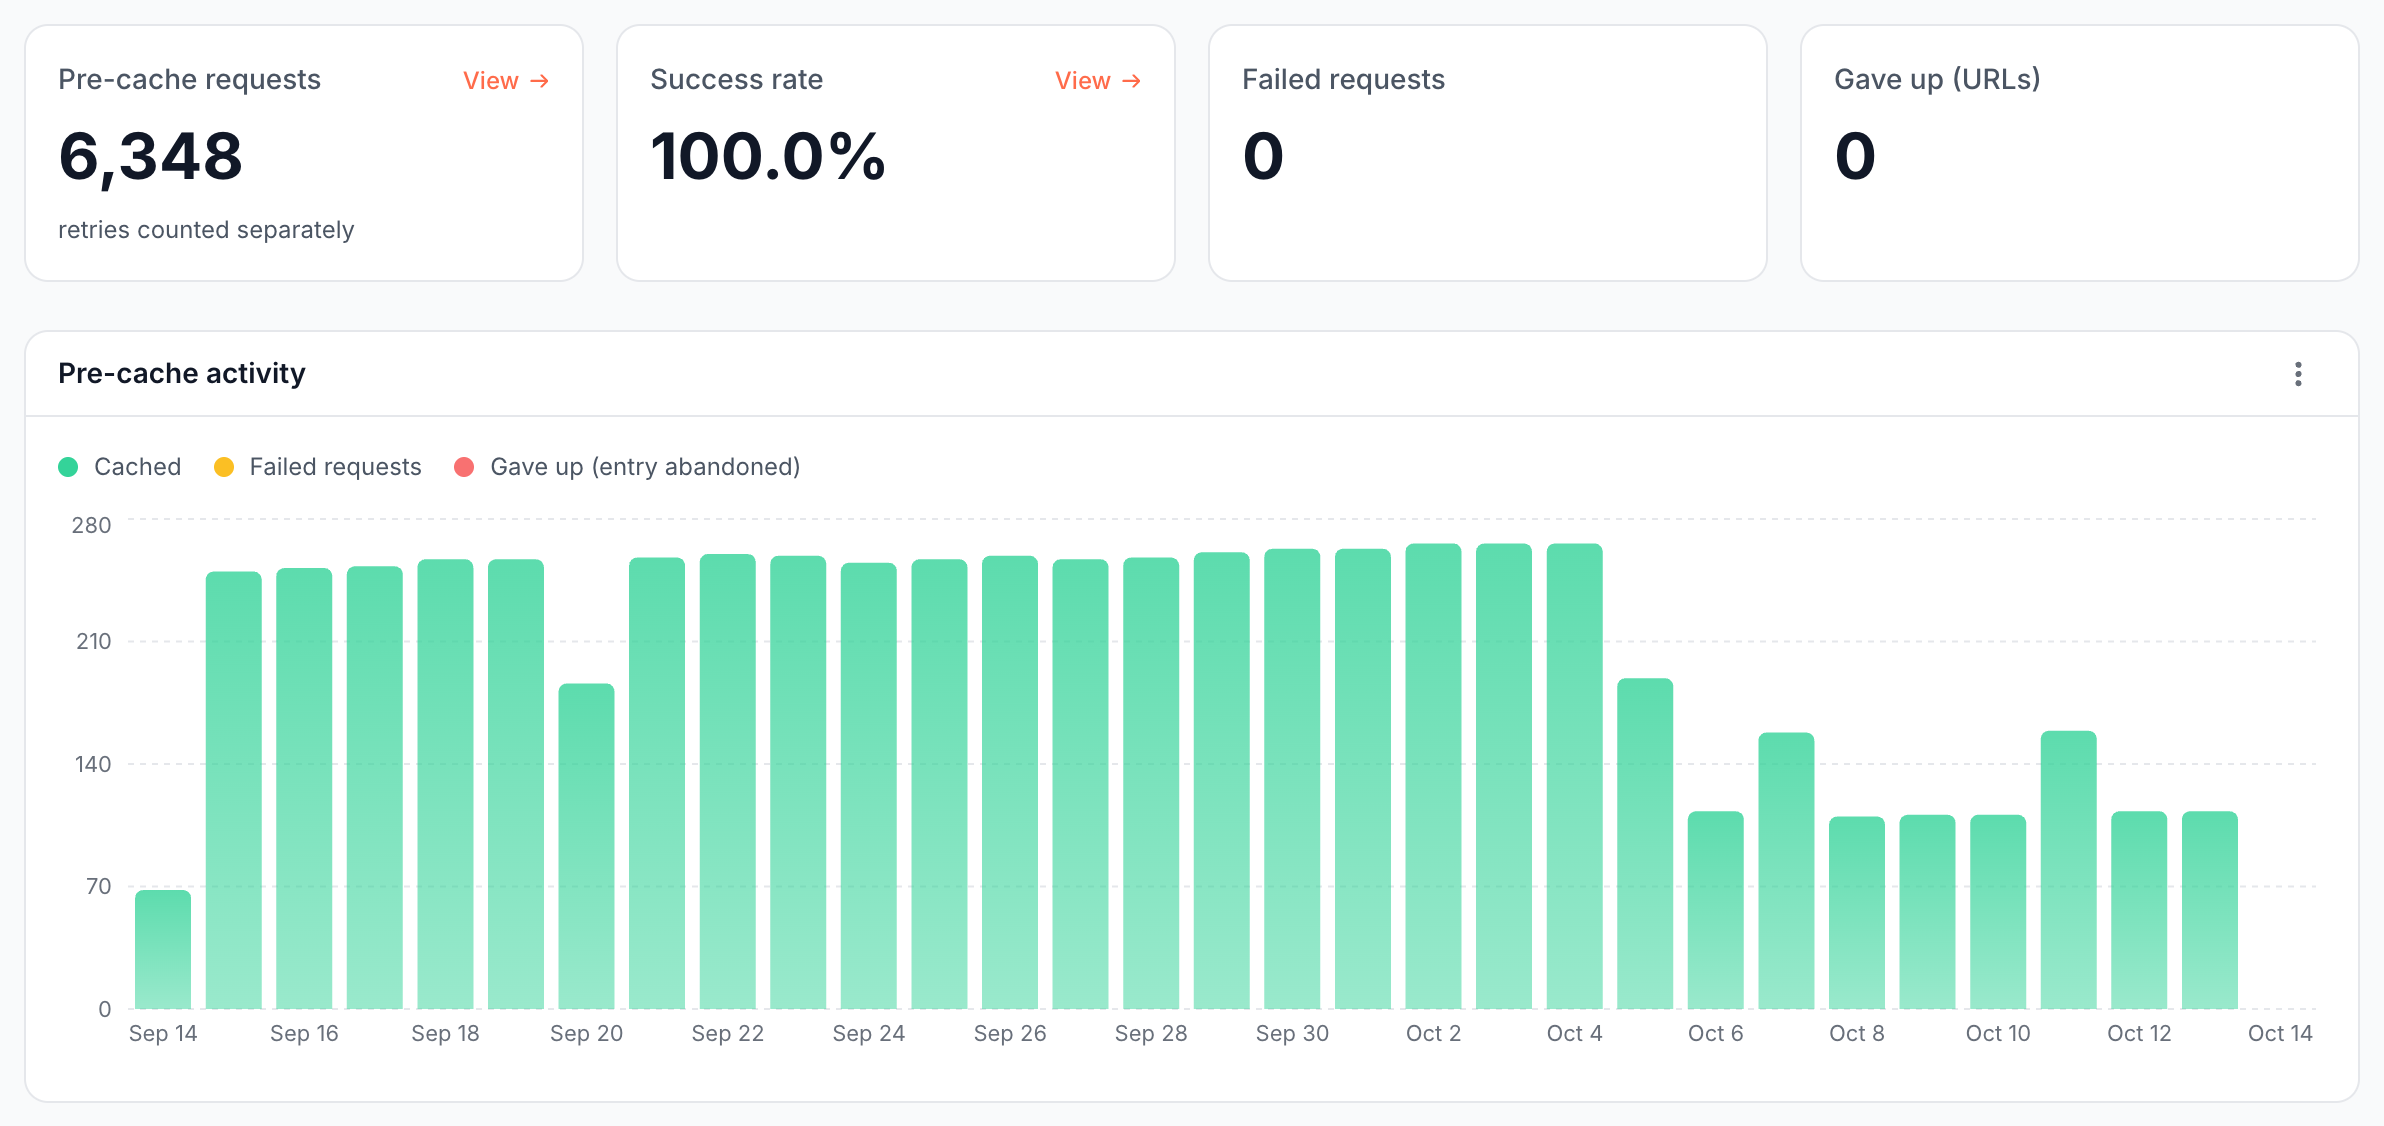
- Pre-cache requests, Success rate, Failed requests and Gave up (URLs), the pages EdgeComet stopped trying after its retries.
- Pre-cache activity: daily Cached, Failed requests and Gave up (entry abandoned).
- Why it fails: each error with its code, requests, pages and the count in the last 24 hours.
- Fetch and render time and Page size: the daily 75th percentile.
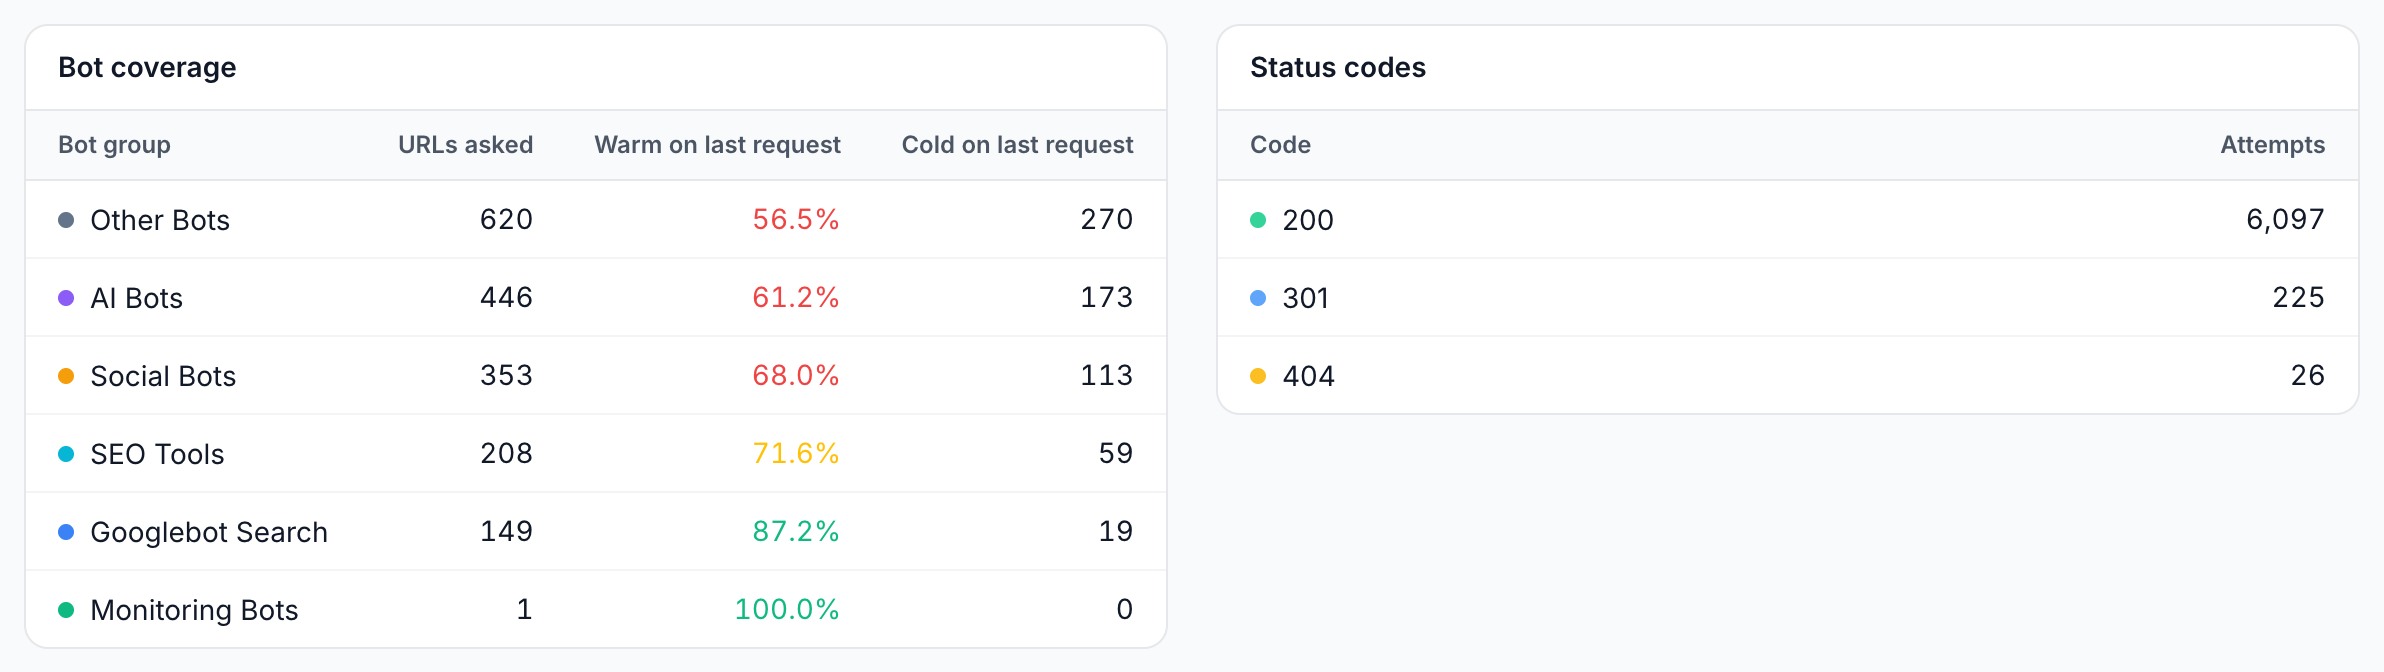
- Status codes: the codes pre-cache received, with attempts.
- Pre-cache rules: each rule's state, last run and next run.
Did pre-cache reach the pages bots ask for?
Bot coverage compares pre-cache with real bot requests. For each bot group it lists URLs asked, the distinct URLs bots requested, and how many were Warm on last request, served from the cache the last time a bot asked, or Cold on last request, built on demand.
How to read it
- Read the hit rate per bot group, not the total. Monitoring bots often request a few URLs many times and can lift the total. Googlebot Search and AI Bots are the groups that decide what search engines and AI assistants read.
- Two hit rates can differ. The Requests Avoided footer leaves out requests that bypass rendering without the bypass cache, while Cache Hit Rate Trend and Cache Efficiency by Bot count them as misses. On a Cache + Render website with the bypass cache off, the footer reads higher.
- Cold URLs are where bots waited. For every cold URL in Bot coverage, the last bot that asked waited for a render or a fetch. A long list of cold URLs for AI bots means pre-cache rules do not cover the pages AI bots ask for.
- Old copies are not stale copies. A copy in 7-30d is still fresh if your Cache TTL is longer than its age.
- Filters: Cache > Overview takes a period, 30 days by default, up to 365 days, and a segment filter. The report starts at your first verified bot visit.
What to do next
| You see | Do this |
|---|---|
| Low hit rate or many cold URLs for Googlebot or AI bots | Turn on Smart Re-cache with those bots under Bot demand, or GSC Re-cache for your top pages |
| Low hit rate for bots that get your server's HTML | Turn on the bypass cache |
| Many copies older than your content changes | Shorten the Cache TTL or add Sitemap Re-cache with Refresh |
| Failed requests or gave-up URLs | Read Why it fails, fix the cause on your server, then recache the pages |
To be told when the rate drops, turn on the Cache hit rate fell alert. See Cache hit rate fell.
Where to find it
In the dashboard: Cache > Overview for hit rate, bandwidth, serve time and copy age, and Cache > Precache > Statistic for pre-cache results. Log Analyzer shows the same cache split for every bot request in its Cache Performance panel, and the Googlebot page shows it for Googlebot in Delivery performance.