

Build SEO data tables and charts from a question
Ask turns a question in plain words into a table of your site's data, such as "sitemap URLs Googlebot did not fetch this month". The table opens on the canvas beside the chat, where you sort, page and export it. Also called natural language queries.
The engine computes each row of a live table from your bot log, Search Console and Evergreen Crawl, joined on the same URLs. A follow-up such as "only blog pages" changes the table instead of starting over.
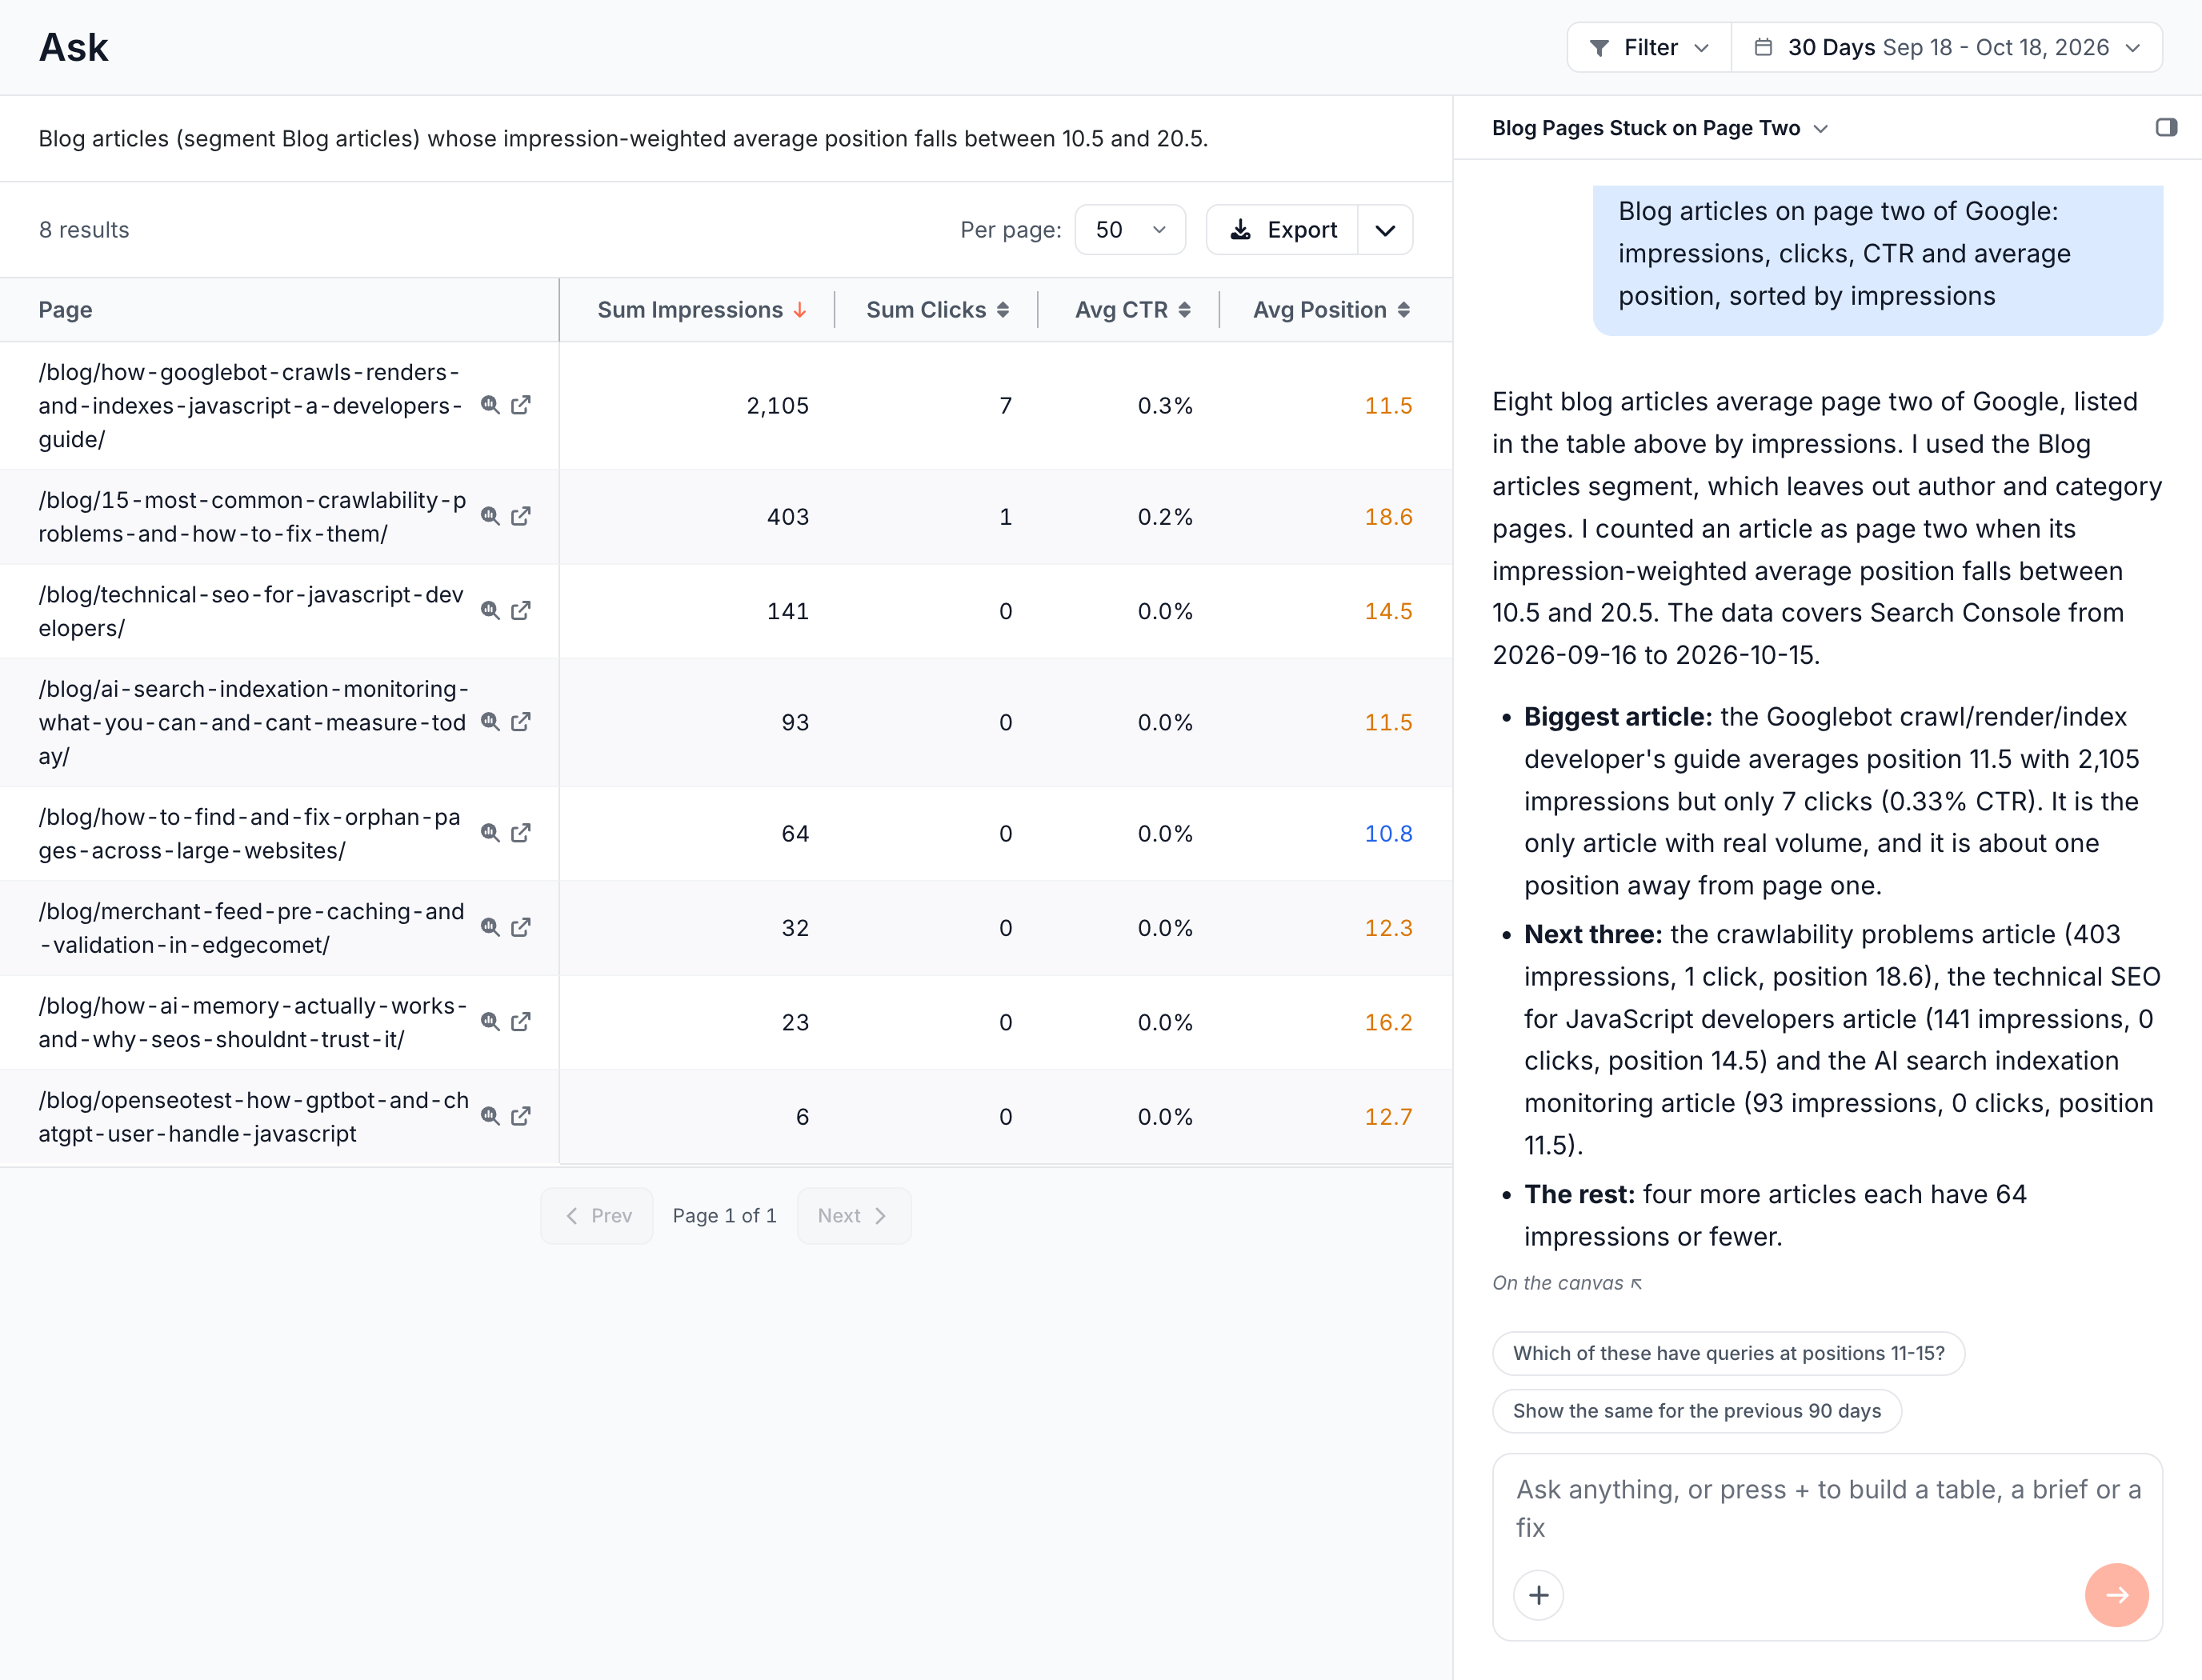
Ask for a table
- Open Ask with Ask > New conversation, or open Data Explorer.
- Optional: press + and choose the Build a table chip. The field then asks "Which pages, and which numbers?".
- Describe the rows and the numbers: which pages (a section, a segment or a condition), which figures (impressions, Googlebot visits, serve time) and the order.
When the question leaves a threshold open, such as "slow", Ask picks one and states it in one sentence ("slow = serve time over 3s"). Name your own number in a follow-up to change it.
The chat reply sums up the result in a few sentences and leaves the rows on the canvas.
Questions to try:
- "Which pages with search impressions take over 3 seconds to serve or do not return 200?"
- "Which blog articles in the sitemap did Googlebot not fetch in this period?"
- "Which pages are on page two of Google, with their impressions and CTR?"
- "Which pages do AI bots fetch most that get no clicks from Google?"
- "List folders by average render time, slowest first, with their bot fetches."
- "Which internal links point to 404 pages, grouped by the linking page?"
See What data Ask can read for every source and field.
Read a table
Each table answer has three parts:
- The description card: what the rows are and the conditions that picked them.
- The table header: the number of results, Per page (10, 25, 50 or 100, 50 by default) and Export.
- The rows: sortable by any column you click. Drag a column edge to resize it, and your browser keeps the width for that table.
An info icon on the description card means the page's Filter or segment did not narrow this table. Hover it for the reason:
- "Filter not applied: this table reads the pages its question was about." The question named its own pages, such as a Focus, and those pages win over the page filter.
- "Segment not applied: "{segment}" has rules other than URL, so tables here read the whole site." To narrow the table to those pages, name them in the question or use a Focus.
- "Filter not applied: tables here read the whole site." The page filter does not apply to this table.
A table with no matching rows shows No results.
Live tables
A live table is the result of a query the engine runs, and it stays connected to your data. Most table answers are live tables.
When you change the period, segment or filter in the page header, the table runs again over the new selection. Sorting and paging run on the server too. Clicking a column sorts every row, not only the rows on screen.
A live table keeps its query for 24 hours after the page loads. After that, reload the page to read it again. See If a table does not load.
Snapshot tables
A snapshot table holds figures no query over your data can express, such as keyword research results, the output of an analysis such as content decay, or data you pasted into the chat.
The agent writes a snapshot from what its tools returned, with up to 50 rows and 8 columns. A snapshot sorts and pages in your browser and keeps the values it had when Ask answered.
Ask uses a live table whenever your own data can answer the question. For a table that re-runs over another period, sorts on the server and exports, ask for figures from your bot log, Search Console or crawl.
Refine a table with a follow-up
Send a follow-up to change the last table: "only blog pages", "add average position", "sort by clicks" or "group by folder". Ask edits the same query and shows the result as a new version of the same tab.
- Versions: the canvas bar shows the version, such as v2 of 2, with Previous version and Next version.
- Tabs: each table, chart, report and document in the conversation gets a canvas tab. When the tabs do not fit, the rest are under N more.
- Suggestions: up to two follow-up questions appear under the latest table. Click one to ask it.
A report answer shows Save as report in the canvas bar. See Save a report.
Charts
Ask draws a chart when you ask for one, and the chart keeps the numbers it had when Ask answered. Ask for a chart in plain words, such as "Googlebot visits by bot type as a pie chart". A chart answer is one of three kinds:
- Stat: one number, such as total AI user bot visits to the blog. Its card is titled Figure when it has no caption.
- Pie: shares of a total, titled Breakdown by default.
- Bar: a value per category, also titled Breakdown by default.
A chart card shows As of with the date and time of the answer. For charts that follow the period, ask for a report instead, which adds trend lines too. See Custom reports.
A pie or bar chart draws up to 12 slices or bars. With more categories, the chart draws the 11 largest and adds up the rest in one Other slice or bar.
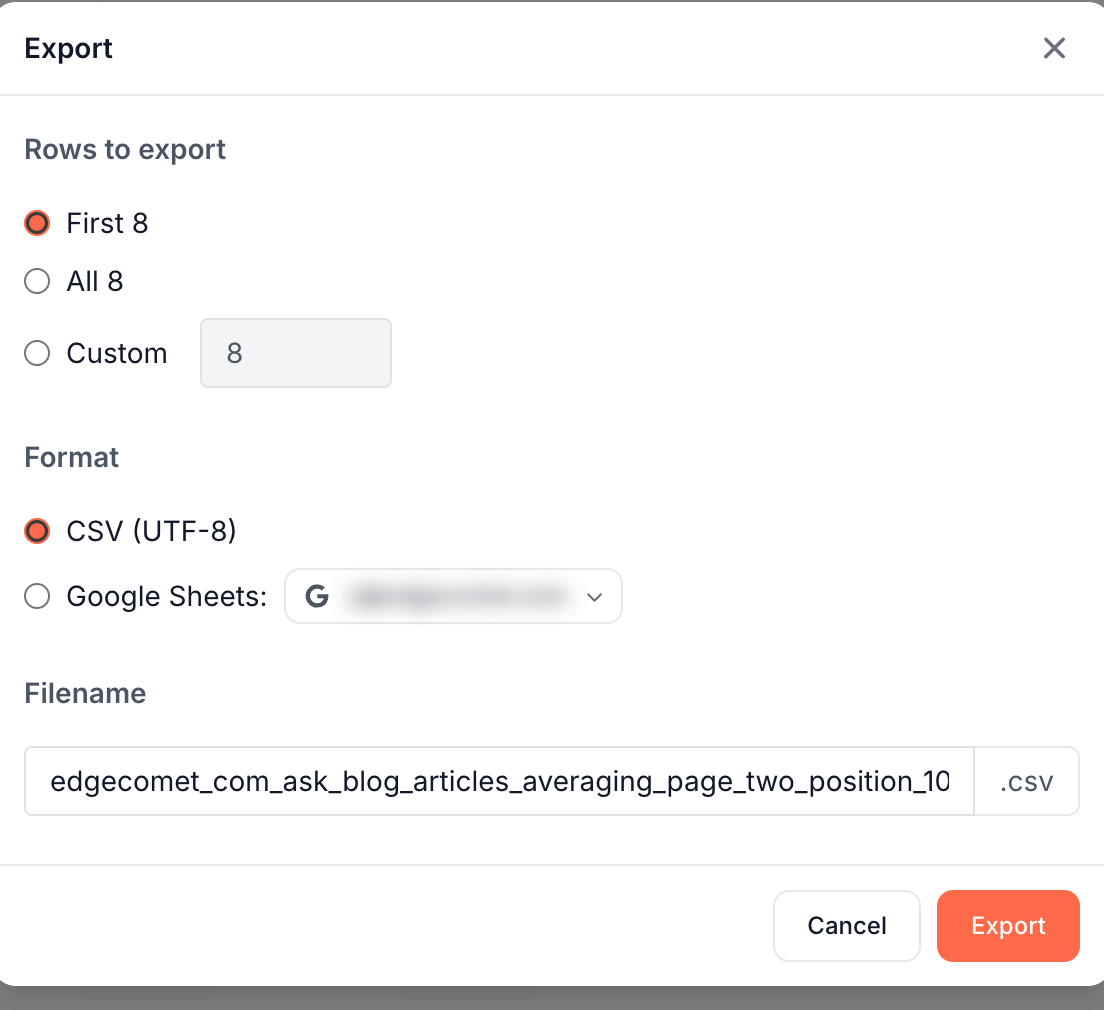
Export a table
Click Export in the table header and choose a format:
- CSV (UTF-8): a file you download.
- Google Sheets: a new sheet of up to 10,000 rows in your connected Google account. See Export Data Explorer tables to CSV or Google Sheets.
The export dialog sets Rows to export (all rows or the first N) and the Filename. The file uses the same columns and column titles as the table on screen.
One export runs at a time per person. While one runs, Export is disabled with the tooltip "You already have an export running".
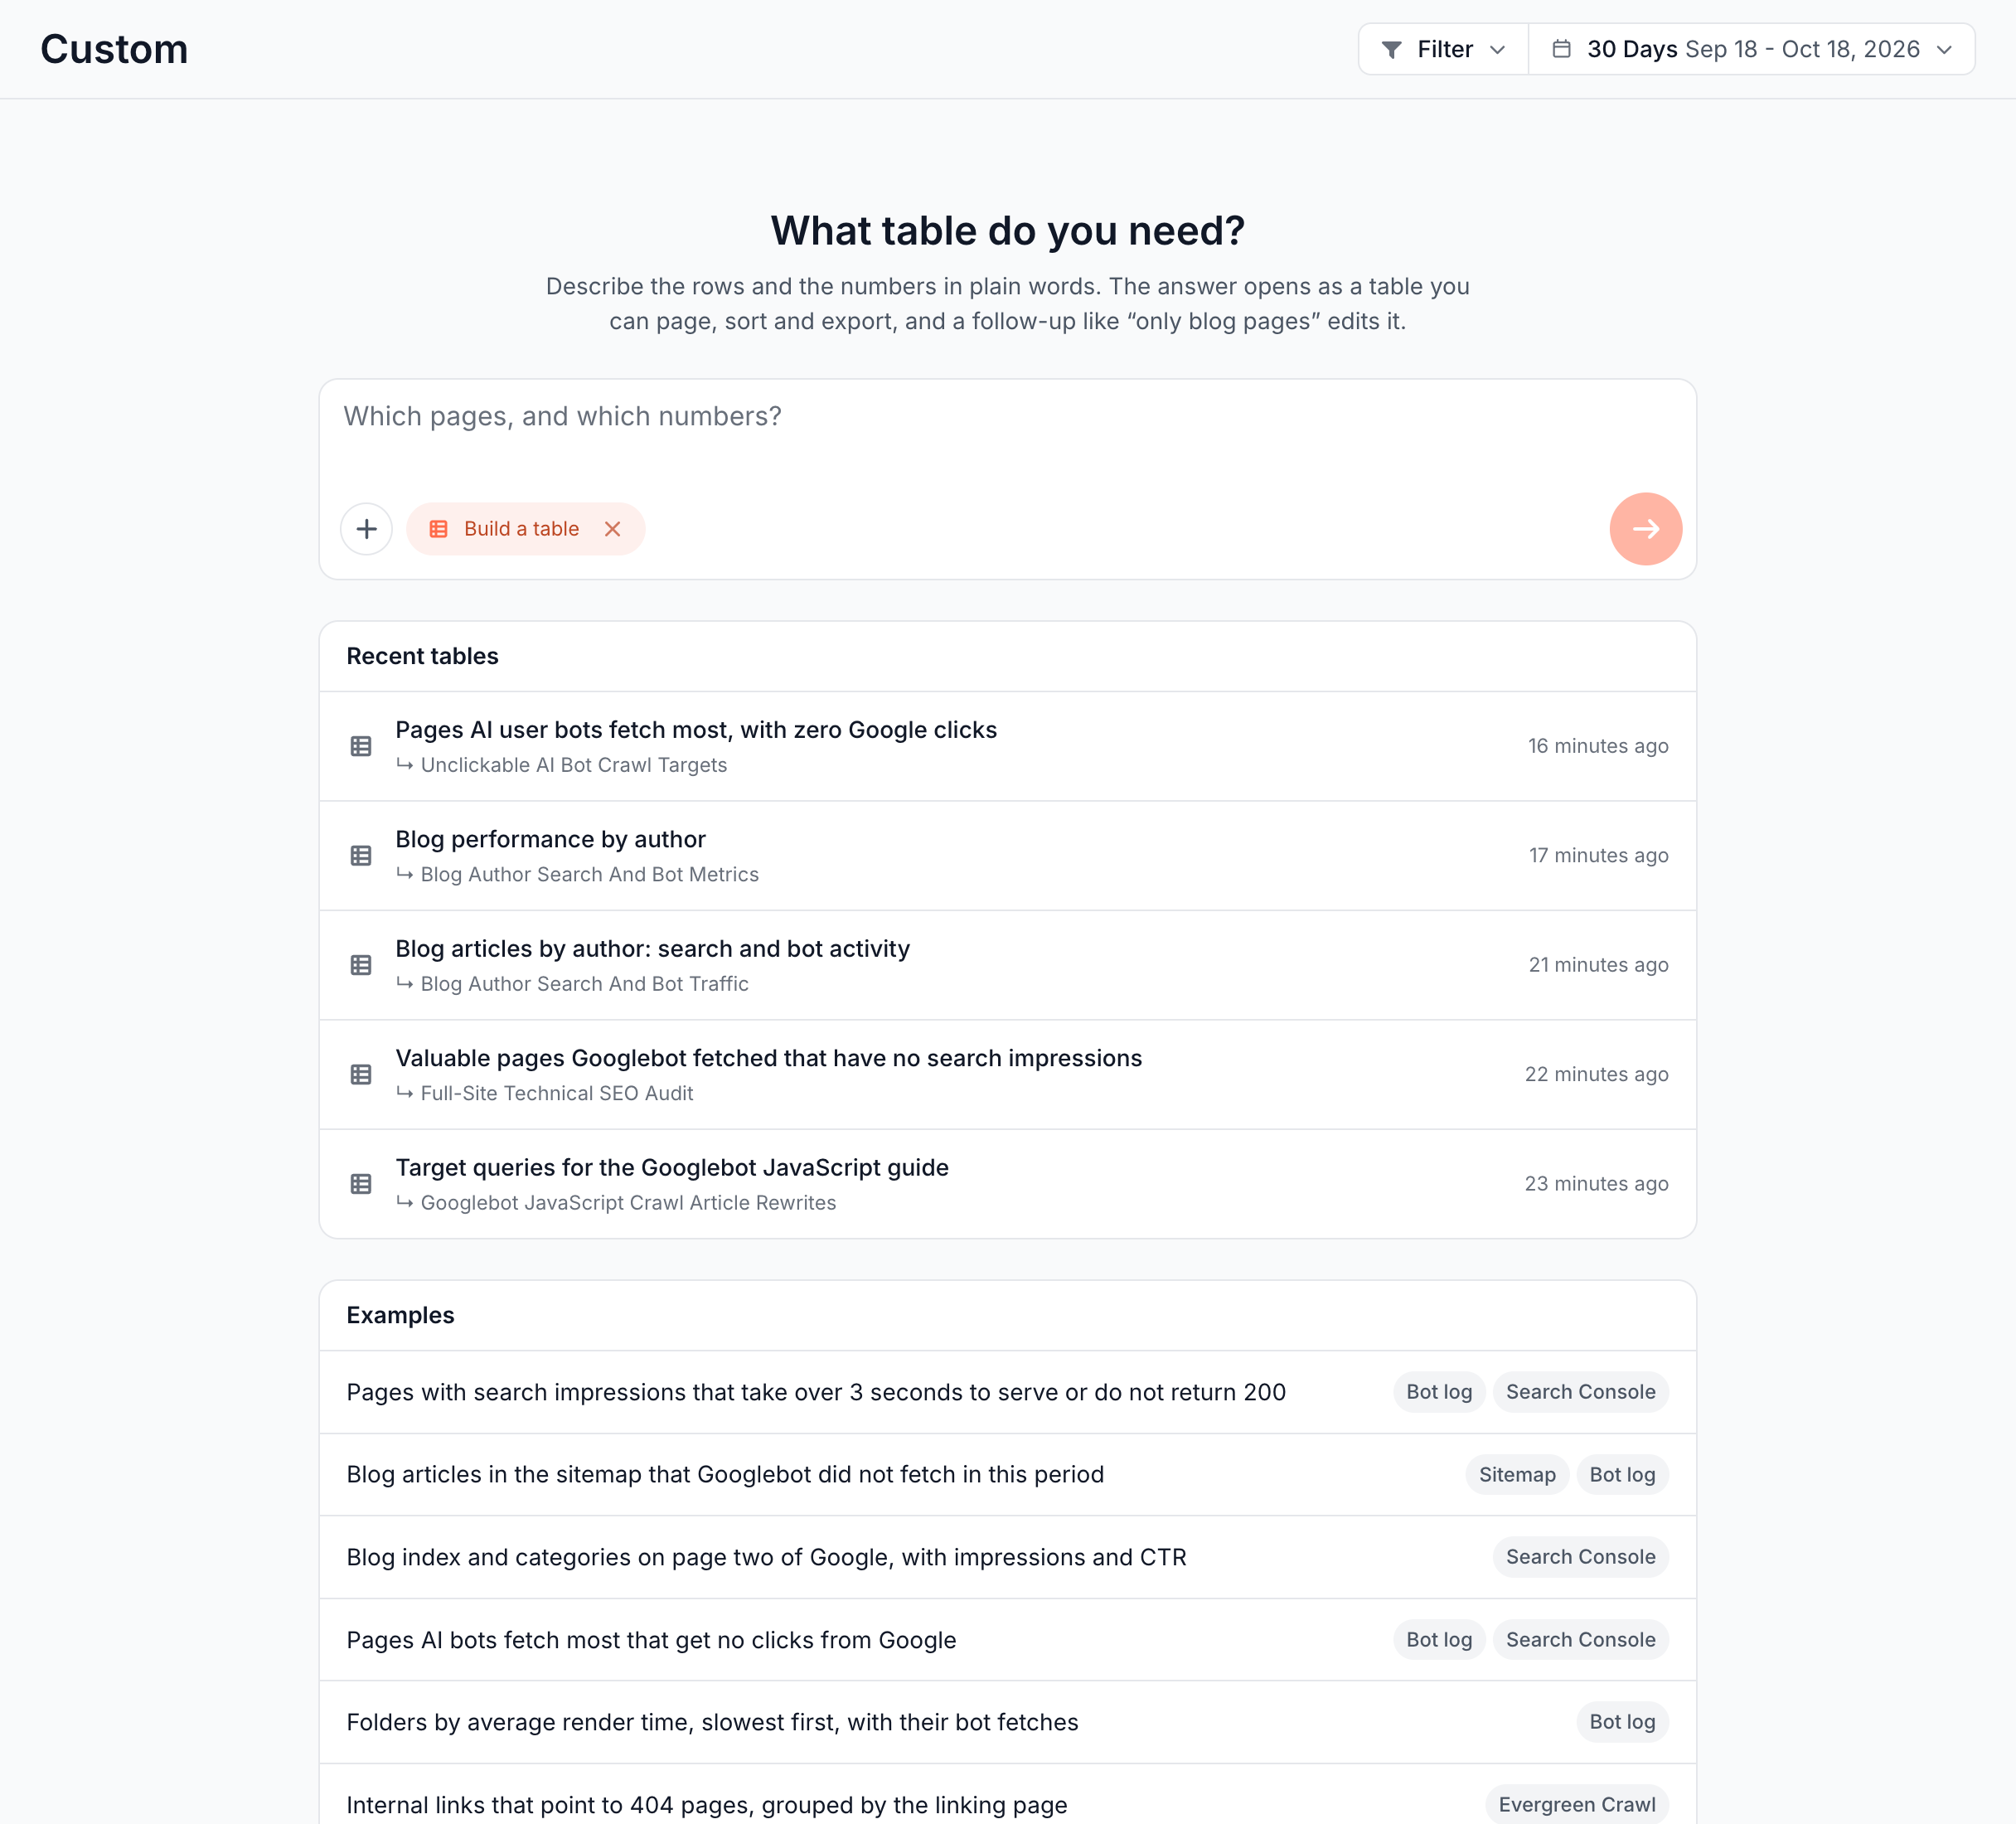
Start from Data Explorer
The first page of Data Explorer, Custom, is Ask set up for tables. It reads What table do you need? and starts with Build a table selected: "Describe the rows and the numbers in plain words. The answer opens as a table you can page, sort and export, and a follow-up like "only blog pages" edits it."
Under the composer, three cards help you start:
- Recent tables: the 5 most recent Ask tables on the site. Click one to open it in its conversation.
- Examples: six starter questions, each tagged with the sources it reads, such as Bot log and Search Console. Where your site has a matching segment, the example uses its name, such as "Blog articles in the sitemap that Googlebot did not fetch in this period".
- Data sources: one row per source, with what you can ask about it and its ready-made tables. See What data Ask can read.
If a table does not load
Each message below names why a table cannot load or run again, and what to do.
"This table has expired. Reload the page to read it again."
A live table keeps its query for 24 hours after the page loads. Reload the page.
"This table can no longer be read. Ask the question again to refresh it."
The table's saved query can no longer run. Send the question again in the same conversation.
"The crawl behind this table is no longer available. Ask the question again to read the latest crawl."
The table read a crawl that no longer exists. Send the question again, and the new table reads the latest crawl.
"This table cannot be re-run for the selected period."
The data the table needs does not exist for the period you picked. Choose another period, or send the question again.
"This site has no crawl to read, so this table cannot be re-run. Ask the question again once a crawl has finished."
The table reads the Evergreen Crawl and the site has none yet. The first crawl appears after 3 days of verified bot visits. See When the first crawl appears.
"This table reads whole-site Search Console totals, which cannot be narrowed to a segment. Clear the segment to re-run it."
Daily site totals from Search Console cover the whole property. Clear the segment in the page header, or ask for per-page Search Console figures instead.
"This column cannot be sorted."
That column is not sortable on the server. Sort by another column, or ask in a follow-up for the rows in that order.
Where to find it
In the dashboard: Ask > New conversation, or Data Explorer > Custom.