

Compare Googlebot's crawl with demand by page type
The Shelf Edge Overview report answers whether Googlebot spends its fetches on the page types that earn demand. Also called crawl allocation vs demand, or crawl budget by page type.
It sets each page type's share of Googlebot fetches beside its share of Google impressions and AI assistant fetches. Page types that earn demand on a small share of the crawl stand out, as do page types that take the crawl and earn little.
Above the chart, three cards count the products and listings that earn Google impressions or AI visits, and a fourth shows the share of impressions on under-crawled page types.
What the report shows
Overview reads one crawl: the Current crawl unless you pick another in the header. Search Console figures use that crawl's dates.
Cards: how many products and listings earn demand?
- Products earning impressions: product pages with Google impressions in the crawl's dates, and their share of all product pages, such as "13.4% of 167,506 products".
- Products visited by AI: product pages fetched at least once by an AI user bot, such as
ChatGPT-UserorClaude-User. - Listings earning impressions: indexable listing pages on their own URL with Google impressions, and their share of indexable listings.
- Demand on under-crawled types: the share of all Google impressions that sits on under-crawled page types. The footer names the page type with the most impressions, such as "Category and listing pages and 9 more".
The first three cards show the change since the comparison crawl as an arrow and a page count. Hover over the change to see which crawl it compares with.
View on a card opens the pages it counts, in the Product pages or Listing pages tab, or in Data Explorer > Evergreen Crawl for under-crawled page types.
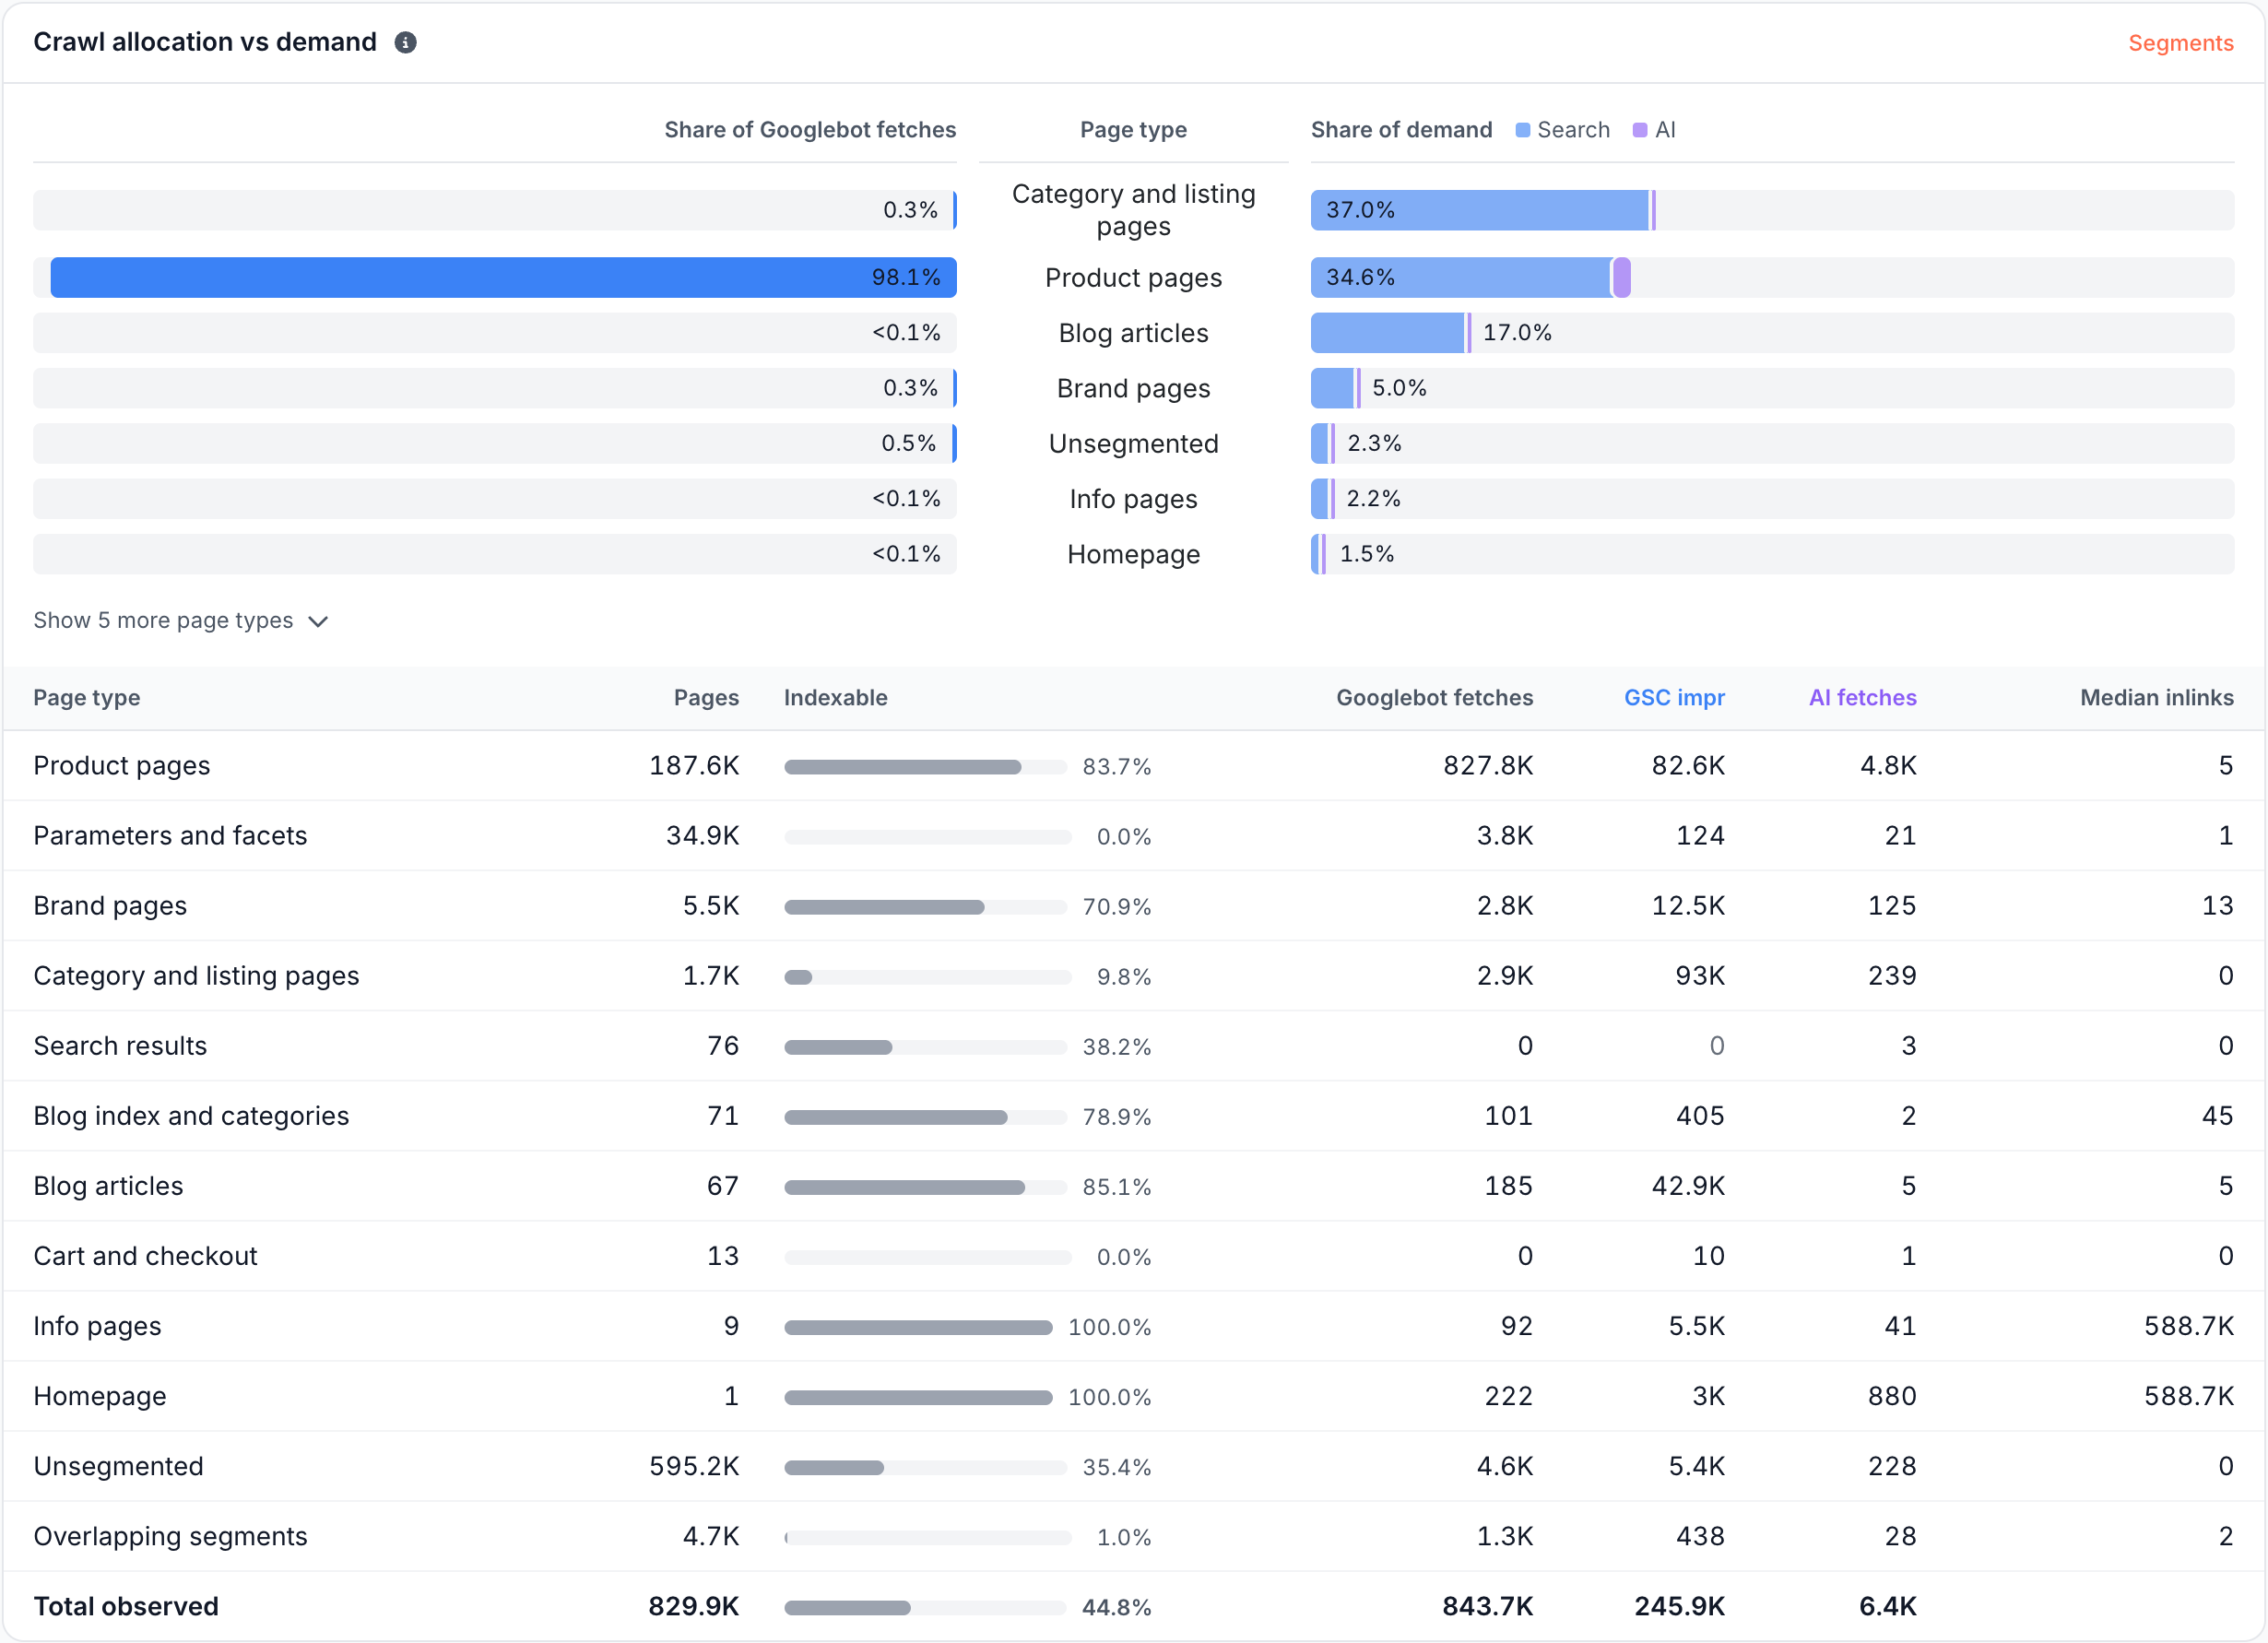
Crawl allocation vs demand: where does Googlebot spend its fetches?
Each row is a page type. The chart has three columns:
- Share of Googlebot fetches: the page type's Googlebot fetches over all Googlebot fetches in the crawl.
- Page type: the name, such as Product pages or Category and listing pages.
- Share of demand: one bar split into Search (Google impressions) and AI (AI user bot fetches). This bar is the one place the two are added: each part is a share of all impressions plus AI fetches in the crawl.
Rows are ranked by demand, and page types small on both sides fold behind Show {n} more page types. A share above zero that is too small to show as 0.1% reads "<0.1%".
Hover over a row for its pages, Googlebot fetches, Search impressions and AI fetches. Click it to open that page type's pages in Data Explorer > Evergreen Crawl. The chart needs Search Console. Without it, the card shows only the table.
The table lists every page type with Pages, Indexable, Googlebot fetches, GSC impr, AI fetches and Median inlinks. Indexable is the share of the page type's pages in the Indexable bucket.
Median inlinks reads "-", with the tooltip "The crawl extracted links from too few pages to read the link graph", when the crawl has too few pages with links. Total observed sums every page the crawl fetched.
Page types: what does each row hold?
A page type is the Archetype set on a segment, such as Product pages, Category and listing pages, Brand pages, Search results, Parameters and facets, Cart and checkout, Blog articles, Info pages or Homepage. EdgeComet creates segments with page types in your first days. See What EdgeComet configures on its own.
Two segments with the same page type share one row. Two more rows collect the rest:
- Overlapping segments: pages two page types claim at once.
- Unsegmented: pages no segment with a page type matches.
A segment that matches every page, or that filters on something other than the URL, stays off the chart. A note under the table counts those segments, such as "2 page-type segments are not on this axis: they match every page, or they narrow on something other than the URL." When no segment has a page type, the card reads "No segment on this site carries a page type." with a Segments link.
Page types here come from your segments. Product pages and listing pages on the cards and on Products and Listings come from your catalog fields, which means the counts can differ from the page-type rows.
Under-crawled page types: which types earn demand on little crawl?
An under-crawled page type gets under 1% of Googlebot fetches in the crawl and earns Google impressions. Demand on under-crawled types is their share of all Google impressions. The Unsegmented and Overlapping segments rows count as page types here.
If none qualifies, the card reads "no demand on types under 1% of fetches". Without page types it reads "no page-type segments on this site", with a Segments link.
Issues: what is wrong on product and listing pages?
The Issues card lists every Catalog Health check that found product or listing pages in this crawl, worst first. The Page column says whether a row is about Products or Listings. Each row shows the pages it found, the change since the comparison crawl, and the Google impressions, AI fetches and Googlebot fetches on those pages.
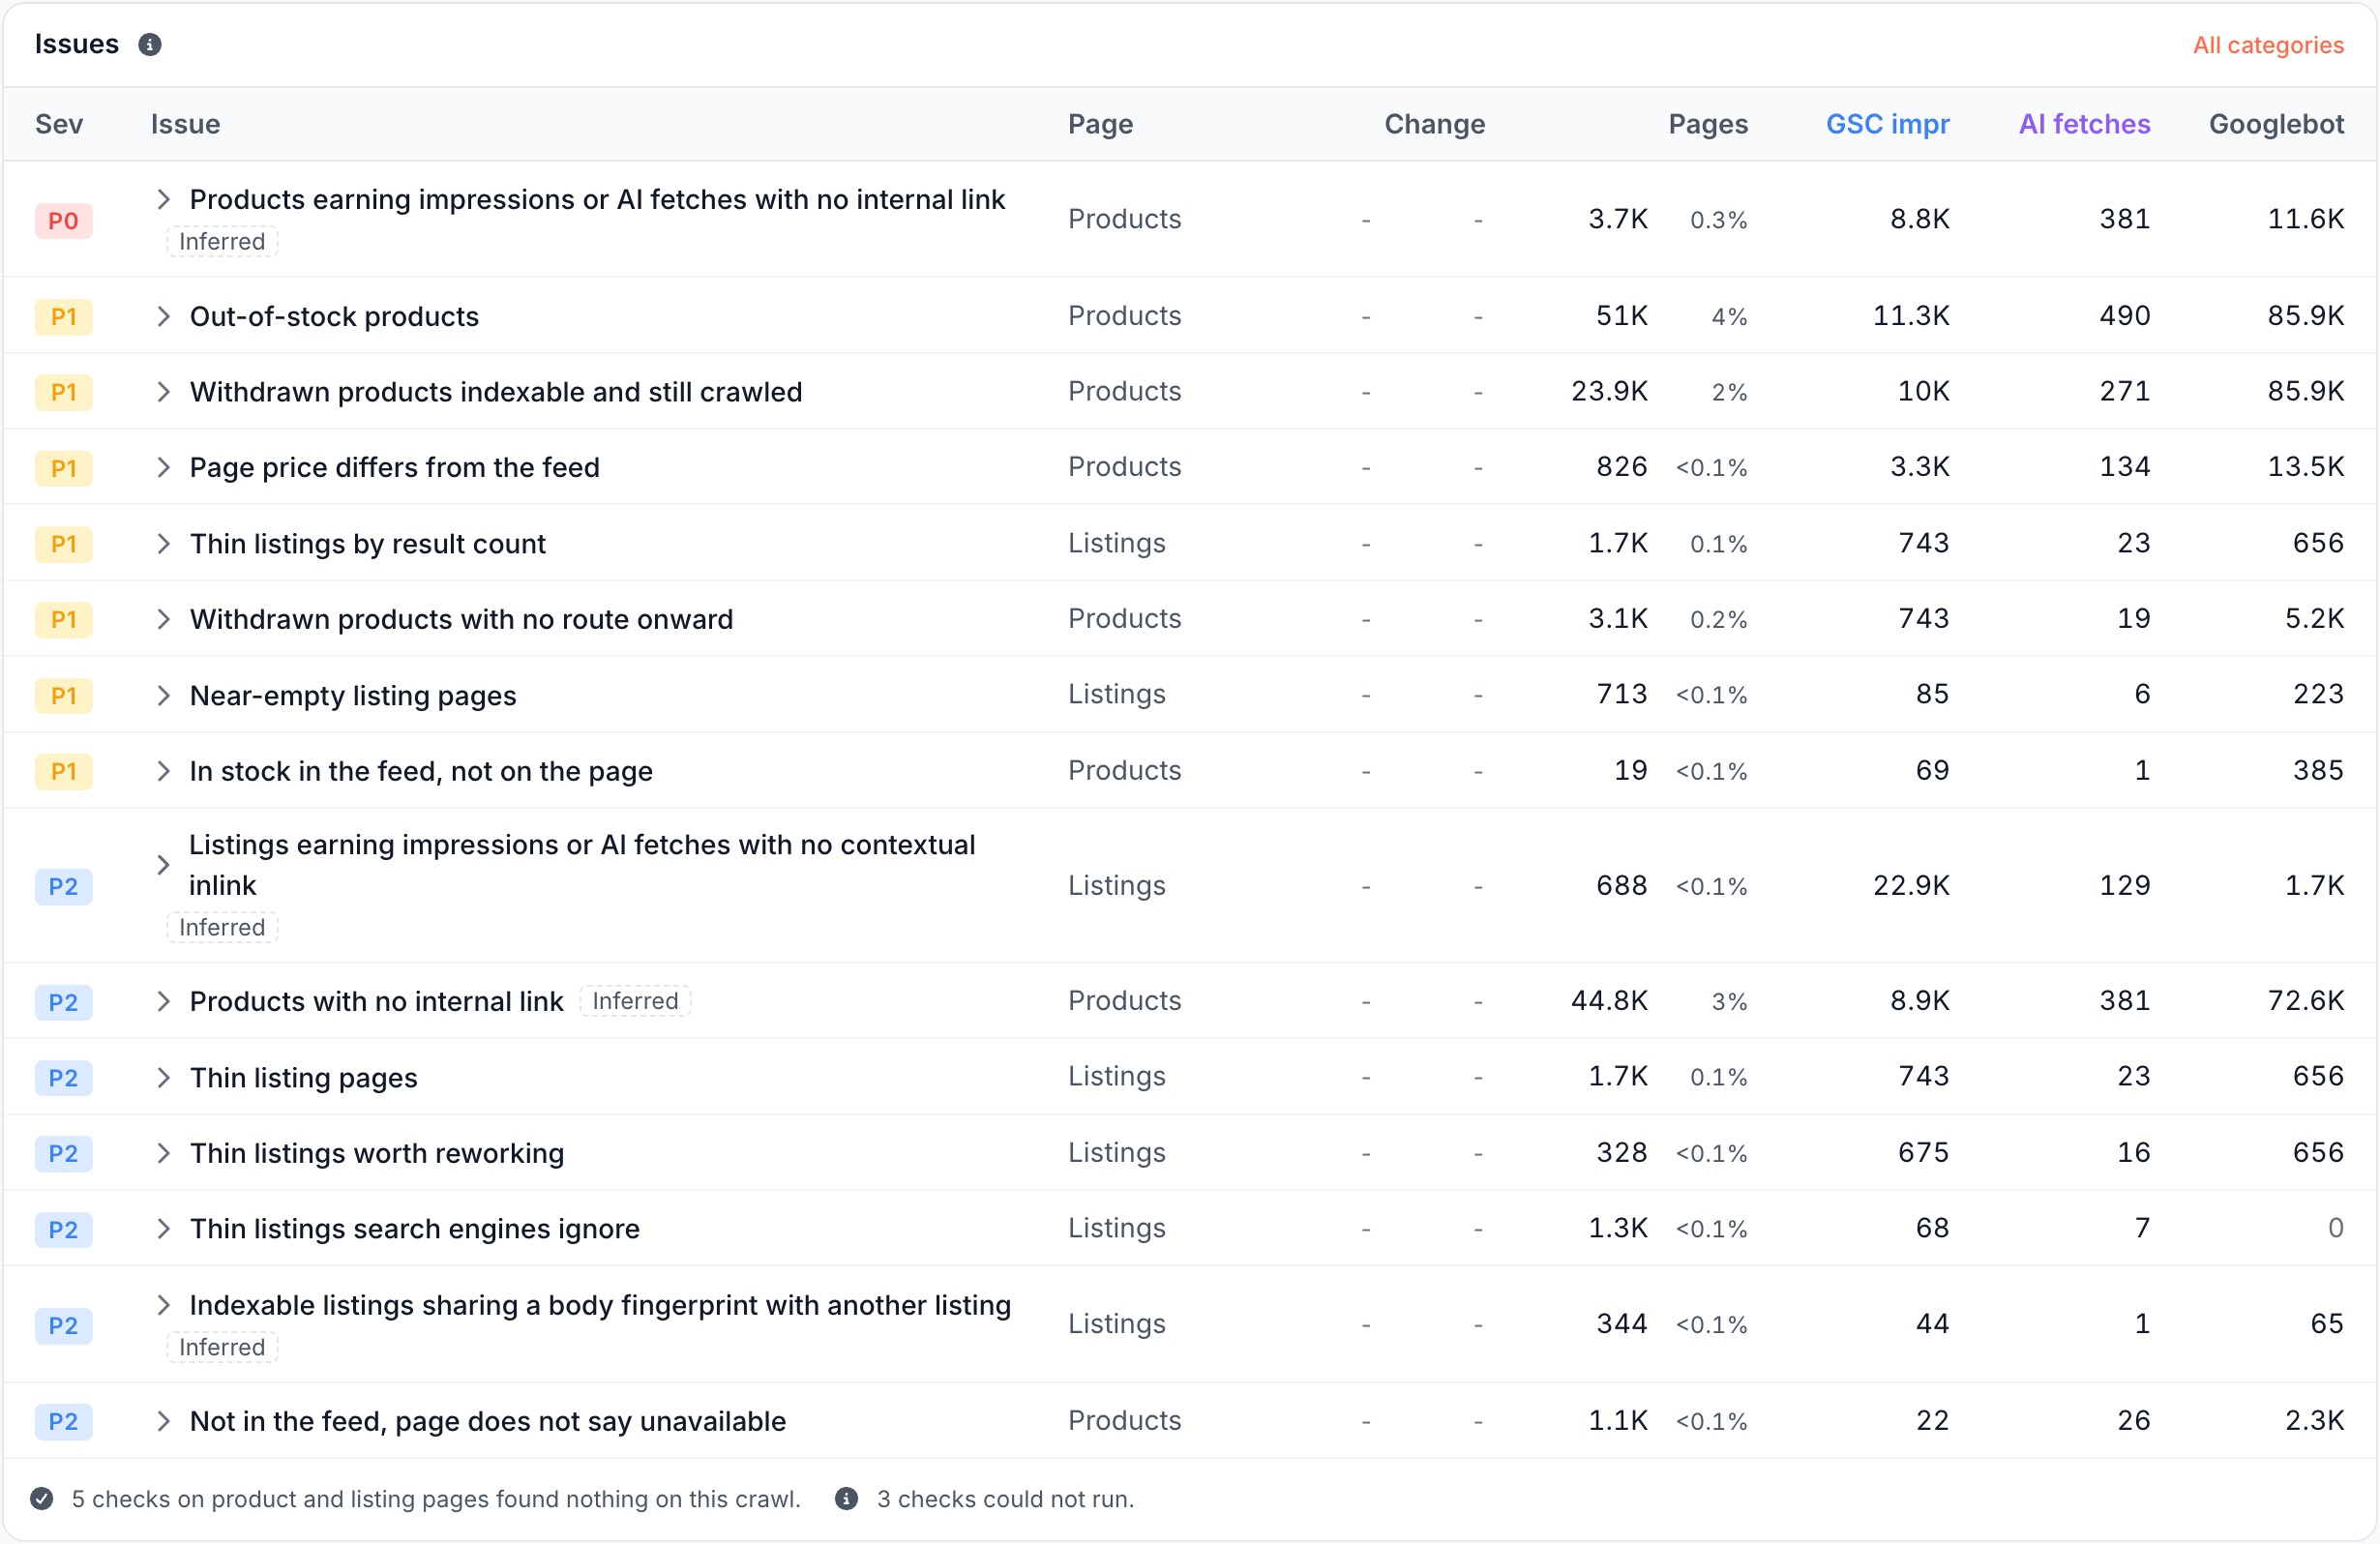
The footer counts the checks that found nothing and the checks that could not run, such as a feed check on a site with no feed. Click a footer line to list them.
All categories opens the full issue catalog. See Find and prioritize technical SEO issues.
How to read it
- High demand, low crawl share: Googlebot under-crawls a page type people search for. On the example store, category pages carry 37% of demand on 0.3% of Googlebot fetches. Googlebot can take longer to see new and changed pages of that type.
- High crawl share, low demand: the crawl goes to pages that earn little. On the example store, product pages take 98.1% of Googlebot fetches for 34.6% of demand. Fetches on a type with no indexable pages, such as Parameters and facets, are crawl waste.
- A large Unsegmented row: many pages have no page type, which hides where the crawl goes. Add or fix segments.
- A large AI share: AI assistants often fetch pages of that type to answer people's questions.
- A low Products earning impressions share: most product pages earned no Google impressions in the crawl's dates. Open View to see the ones that earn, then compare with Products.
What to do next
- Link under-crawled page types from content and navigation. See Find orphan pages, weak internal linking and broken links.
- Cut crawl spent on parameters, facets and internal search. See Does EdgeComet stop bots from crawling wasted URLs?
- Check how Googlebot splits its crawl over time. See Crawl efficiency: valuable, questionable and wasted crawls.
- Keep product and category pages cached and fresh for bots. See Pre-cache pages before bots request them.
- Ask "Does crawl follow product demand?" or "Are product pages being surfaced?" with the Ask button.
Where to find it
In the dashboard: E-commerce > Overview. The header has Filter, the crawl picker and Ask. There is no period control: the crawl sets the dates.