

Status codes, response times and page sizes bots receive
EdgeComet shows what every bot received from your site in four tabs of Log Analyzer > Overview. The tabs cover all bots, search engines and AI bots alike.
- Status Codes: the HTTP status of each response.
- Loading Time: how fast EdgeComet served each response.
- Page Size: how heavy the HTML was.
- Bot Breakdown: which bots asked.
Requests from fake bots are left out, except in the Fake Bots rows of Bot Breakdown. The charts also leave out pre-cache refreshes, which no bot asked for.
For how much bot traffic the cache serves, see Monitor cache hit rate and cached URLs.
What the report shows
The Status Codes, Loading Time and Page Size tabs each pair a daily chart with a Breakdown that compares the period with the previous one, and a Segments table with the same numbers per segment. The Counts and Percentage switch on each chart shows bars as requests or as shares of the day. Bot Breakdown is a single table.
Which status codes do bots get?
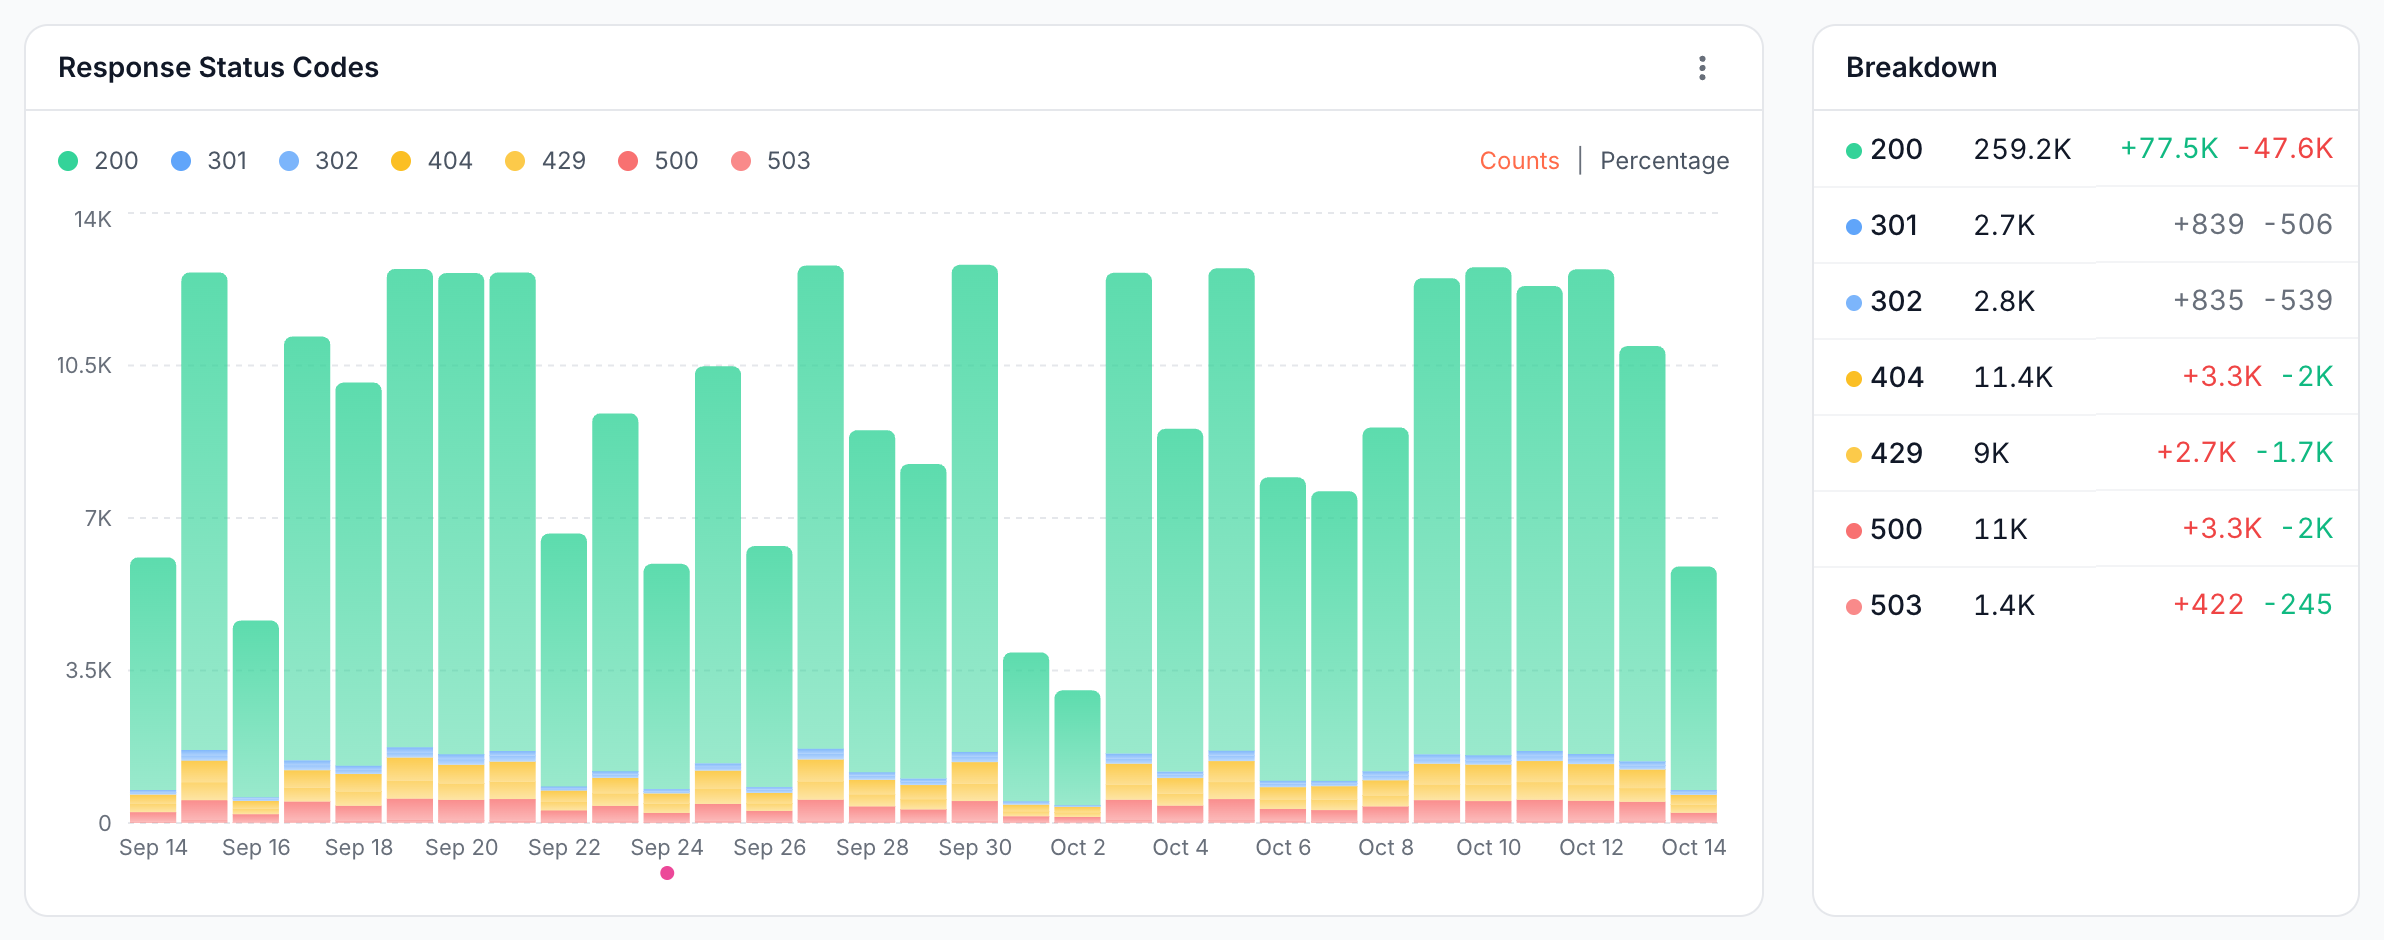
The Status Codes tab shows every status code bots received, including Error events, which Loading Time and Page Size leave out:
- Response Status Codes: requests per status code per day, such as
200,301,404,429and500. - Breakdown: for each code, the requests in the period, then the pages that started getting that code (+) and the pages that stopped getting it (−) compared with the previous period. A page counts under the code of its last request in each period: +3.3K next to
404means about 3,300 pages whose last bot request got a404this period but did not in the previous one. Click a request count to list the requests in the Bot log, or a + or − count to list the pages in New and lost URLs. - Segments: per segment, the requests and the number of
2xx,3xx,4xxand5xxresponses.
Status classes: 2xx, 3xx, 4xx and 5xx
A status class is the first digit of an HTTP status code, which Log Analyzer uses to group codes: 2xx success, 3xx redirect, 4xx client error such as 404 Not Found, 410 Gone or 429 Too Many Requests, and 5xx server error. The Response Status Distribution panel on the Overview tab and the Segments table on the Status Codes tab show requests by class.
How fast does EdgeComet serve bots?
The Loading Time tab sorts requests by serve time into five bands, <0.5s, 0.5-1s, 1-2s, 2-5s and 5s+:
- Serve Time Distribution: requests per band per day, with an Avg serve time line.
- Breakdown: requests per band, with the change against the previous period. A change that makes serving slower, fewer fast requests or more slow ones, shows in red.
- Segments: per segment, the requests in each band, so you can see which sections are slow.
Serve time: what EdgeComet measures
Serve time is the time EdgeComet takes to answer a bot request, from the moment it starts handling the request to the moment the response is ready. It includes the cache lookup and, for a page rendered on request, the whole render.
Serve time does not include the network between the bot and your CDN, or the hop from your CDN to EdgeComet, so it is not the time to first byte a bot measures.
How long it takes depends on the event type:
- Cache Hit: under 15 ms.
- Bypass Cache: the time to read the copy from the cache.
- Render: as long as the page takes to load and settle in a browser, usually seconds.
- Bypass: as long as your server takes to answer.
Serve time covers Cache Hit, Render, Bypass and Bypass Cache requests, whatever their status code. Error events and pre-cache refreshes are left out.
How heavy is the HTML bots receive?
The Page Size tab measures the HTML of each 200 response:
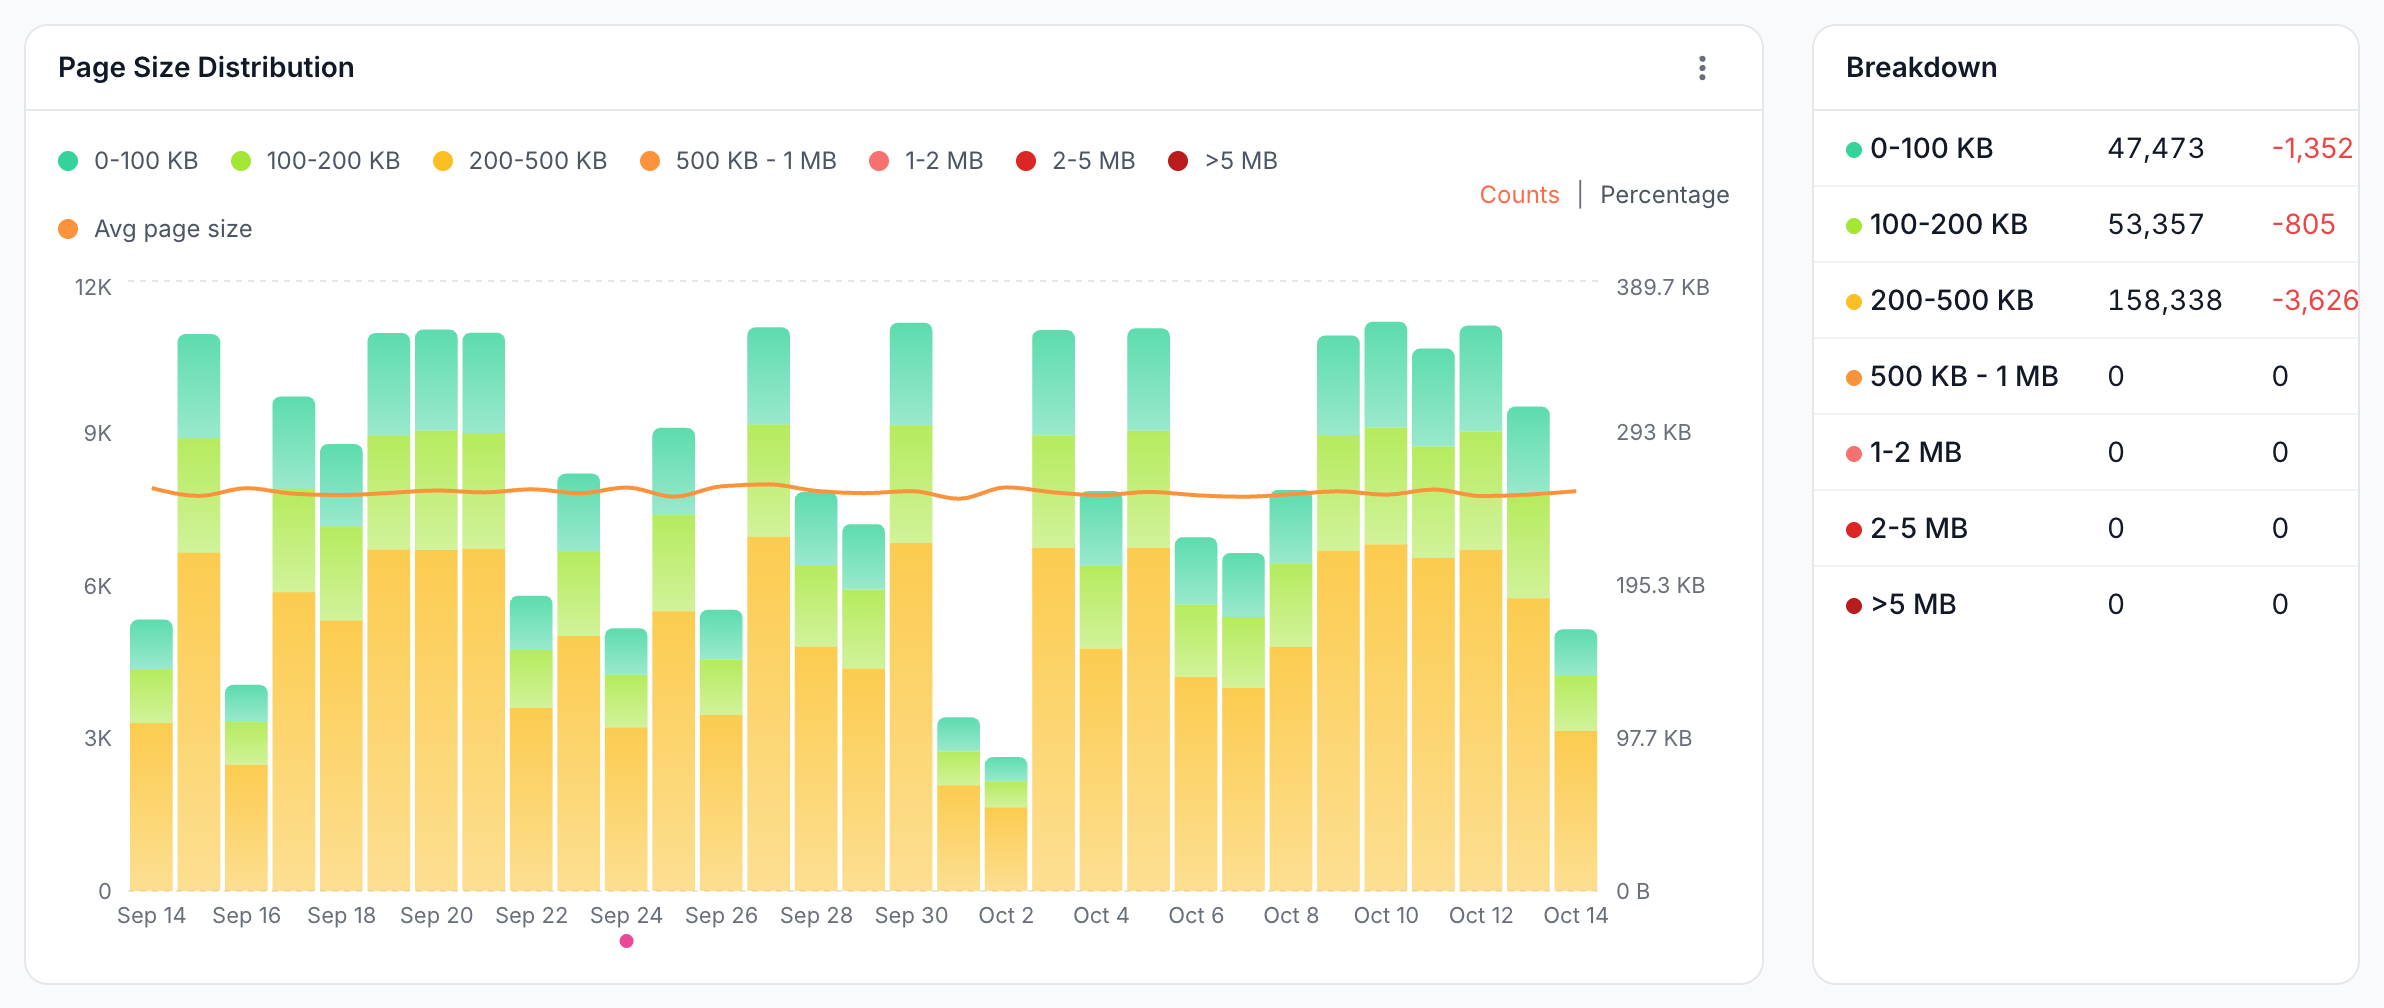
- Page Size Distribution: responses per size band per day, with an Avg page size line.
- Breakdown: responses per band, with the change against the previous period.
- Segments: per segment, responses in four wider bands: <100 KB, 100-500 KB, 500 KB-2 MB and >2 MB.
- Pages with Fluctuating Size: pages whose HTML size swings from day to day, sorted by Range or Last deviation. The 100 largest swings are shown, and with none, the card reads "No URLs with significant page-size fluctuation in this period." A page is listed when all three are true:
- Its largest daily average size is at least 1.5 times its smallest.
- It had five or more
200responses on each of at least three days. - Its daily average size is at least 5 KB.
- Render Weight: the full weight of rendered pages. See Render weight.
Page size bands: the size ranges in the report
A page size band is a range of HTML sizes used to group responses. The chart and Breakdown use seven bands, 0-100 KB, 100-200 KB, 200-500 KB, 500 KB - 1 MB, 1-2 MB, 2-5 MB and >5 MB, and the Segments table uses four wider ones. Page size is the HTML document only: images, scripts and stylesheets are not included.
Render weight: what a full render downloads
Render weight is everything the browser downloaded while EdgeComet rendered a page: the HTML plus scripts, stylesheets, images and fonts. The Render Weight card shows Render events, Avg total bytes, p90 total bytes and Same-origin vs third-party, the split between files from your own site and from other domains. Open Renders report leads to the render reports.
Render weight comes from renders only. A site served entirely from cache or in Cache-only mode shows "No render events in this period."
Which bots crawl the most?
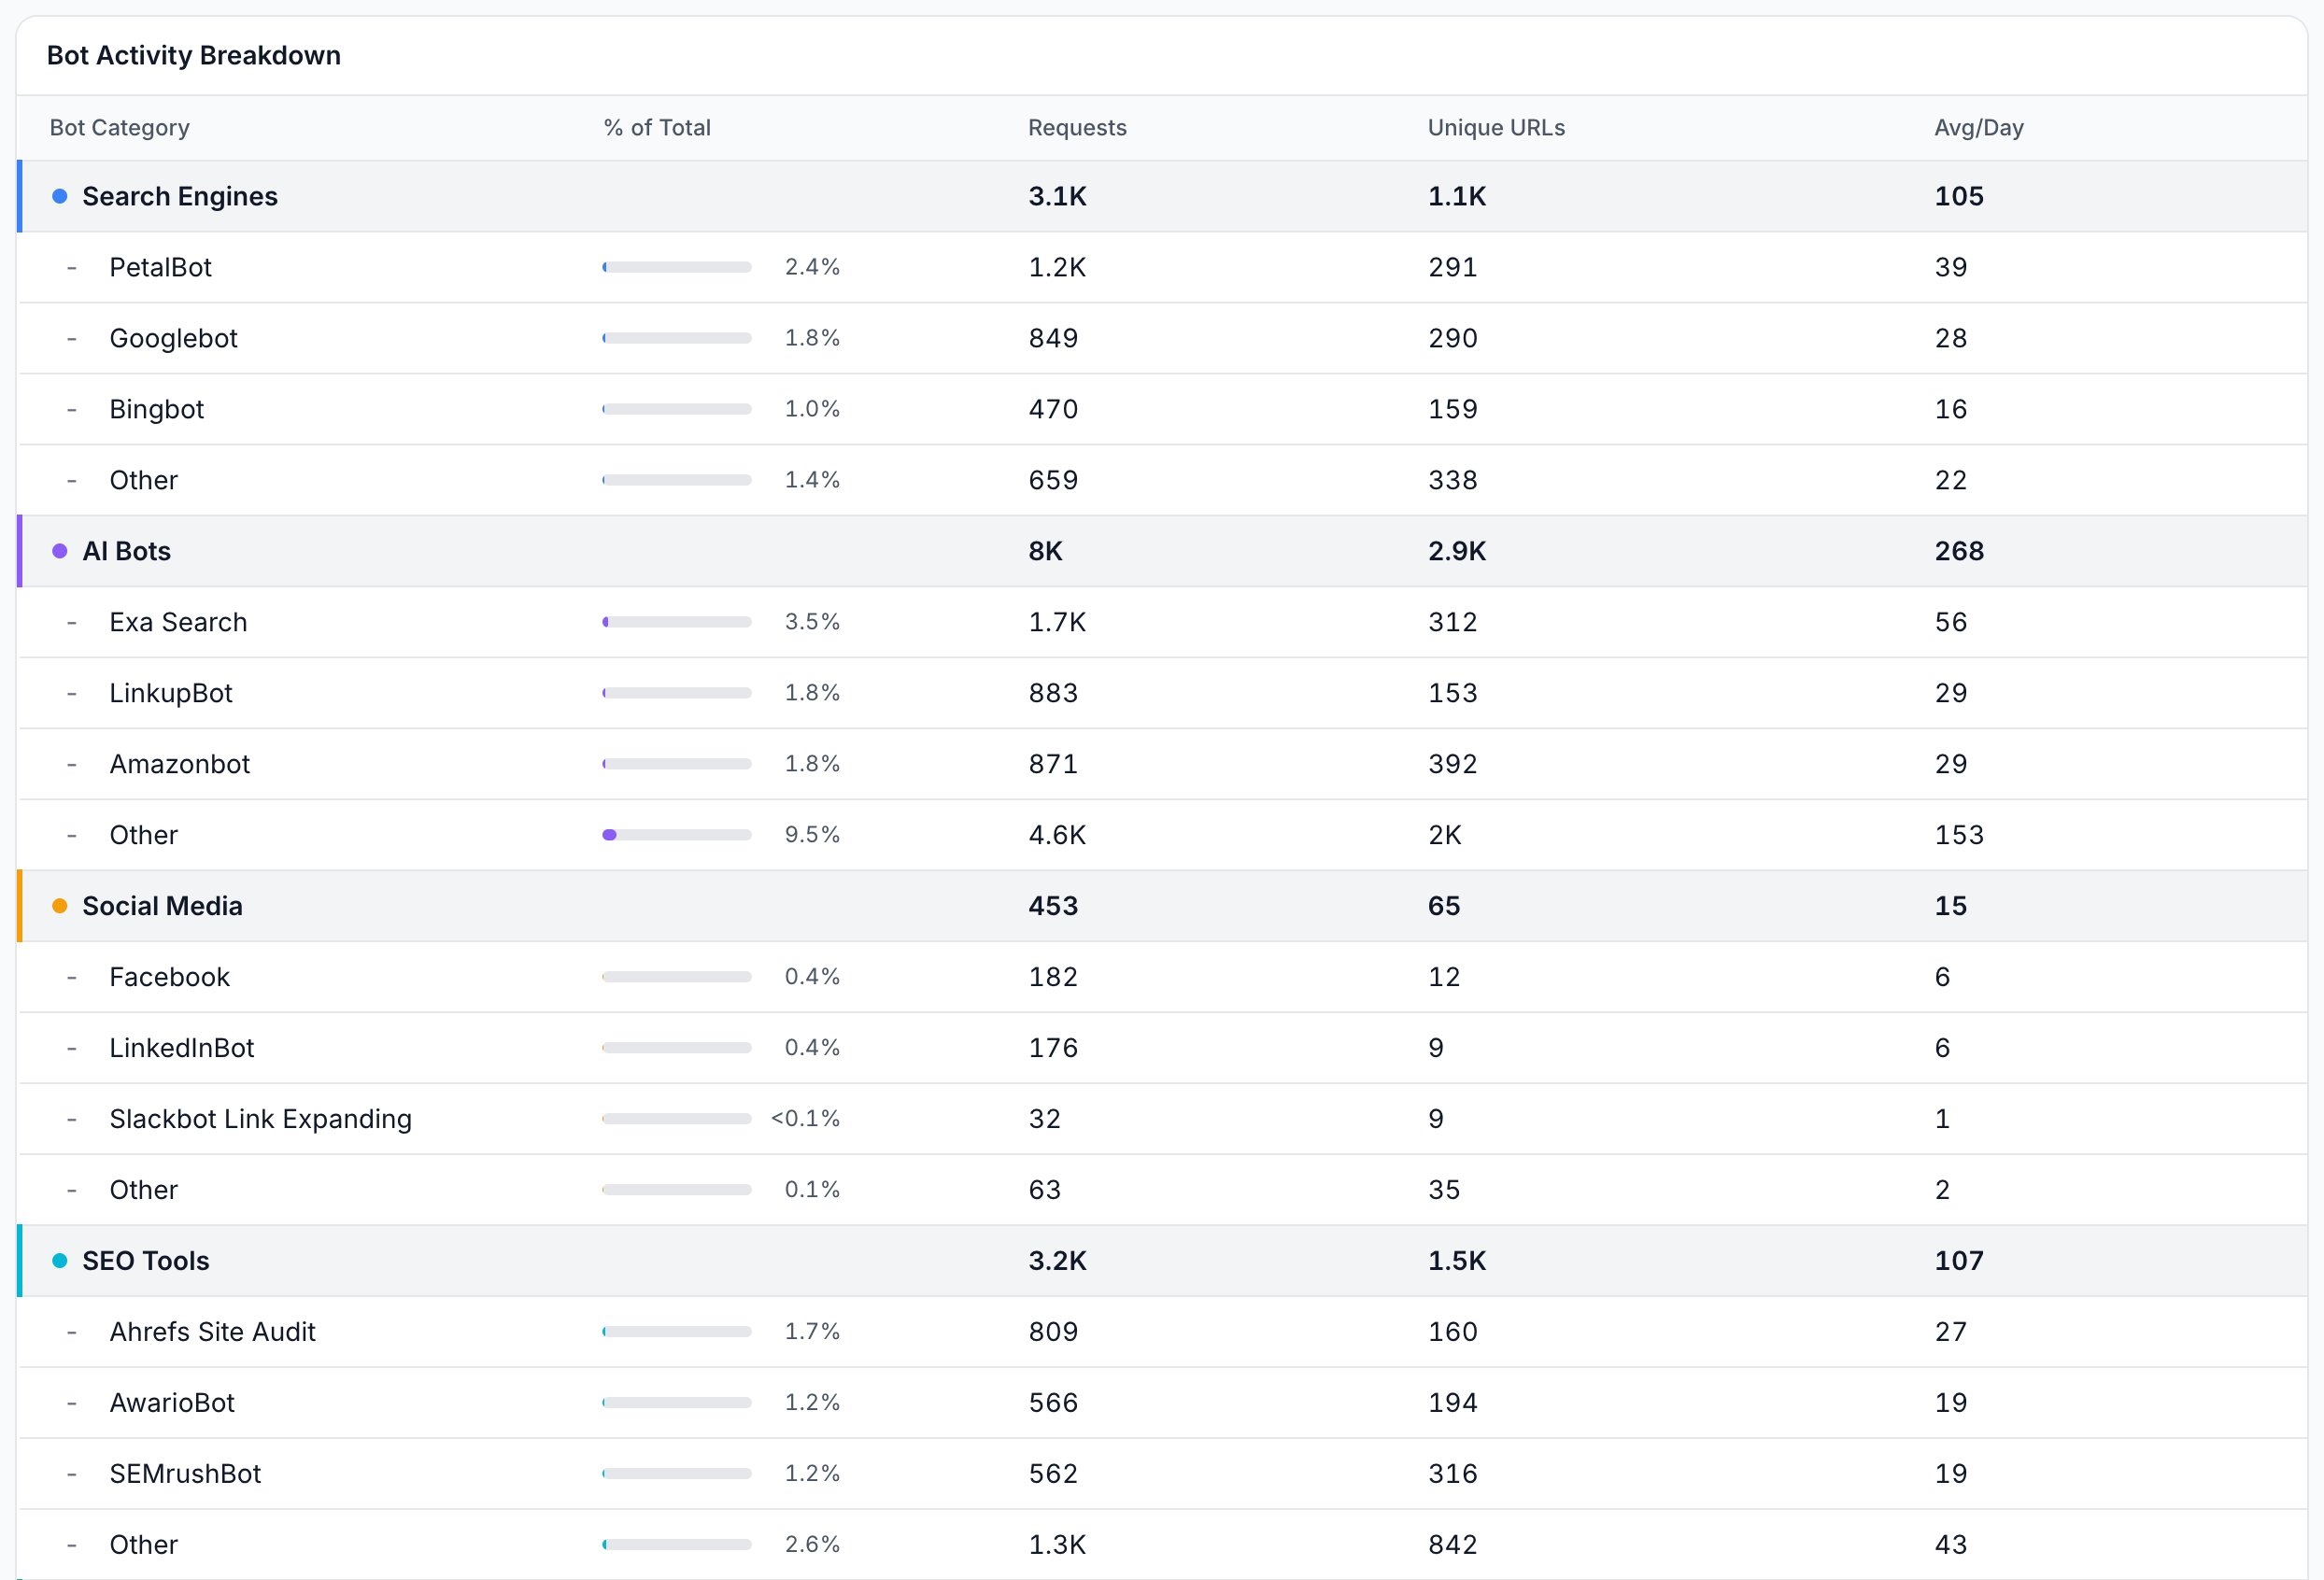
The Bot Breakdown tab lists every bot by category: Search Engines, AI Bots, Social Media, SEO Tools, Monitoring, Other Bots and Fake Bots. Each category shows its three busiest bots and an Other row, with % of Total, Requests, Unique URLs and Avg/Day (the requests divided by the number of days in the period).
The desktop and mobile versions of Googlebot, Bingbot, Yandexbot and Applebot share one row. Social Media holds the link preview fetchers that Social Bots reports on. In Fake Bots, each row is the bot the fake requests claimed to be.
How to read it
These changes on the four tabs point to a problem worth checking:
- Pages start answering
404or5xx. A large + count in the Status Codes Breakdown often means a release, a migration or a removed section broke pages that bots still request. 429Too Many Requests appears. Your server or a rate limiter is turning bots away. For how Google responds to429and5xxresponses, see Server speed and the crawl capacity limit.- Slow bands grow. More requests are waiting for a render or your server. Check whether fewer requests come from the cache on the Overview tab's Cache Performance panel.
- A page's size swings. A page that is sometimes half its usual size may render partly, time out, or show an error page with a
200. Open it in Data Explorer to compare its fetches. See Fix blank, partial or slow prerendered pages. - Render weight grows. Heavier pages take longer to render. A large third-party share means much of the weight comes from other domains, such as tag managers and widgets.
- Monitoring or Other Bots takes a large share. Uptime monitors and unknown crawlers add to Total Requests on the Overview tab, but not to the Googlebot, Bing or AI Bots reports.
What to do next
Most findings on these tabs lead to one of these fixes:
- Fix pages that started failing. Click the + count next to
404or5xxto list them, then restore the pages, update links that point to them, or redirect them with an Edge SEO rule. - Get alerted next time. The built-in alerts Origin stopped answering, Pages started answering 4xx, Responses got slower and Renders came back hollow watch the same requests. See Alerts.
- Serve more requests from the cache. Pre-cache rules render pages before bots ask, so fewer requests wait for a render.
- Check unwanted bots. Large Fake Bots or Other Bots shares lead to Bad Bots.
Where to find it
In the dashboard: Log Analyzer > Overview, tabs Status Codes, Loading Time, Page Size and Bot Breakdown.