

Find and prioritize technical SEO issues
The Evergreen Crawl Issues report lists every technical SEO issue found on the pages search engines and AI bots received from your site. Each issue names its pages, the Google impressions and AI assistant fetches on them, and how many pages entered or left it since the comparison crawl.
More than 150 checks run on every crawl, in 11 categories, from broken redirects and noindex pages to duplicate titles and invalid JSON-LD. You never set up a crawl to get them: the report reads the Current crawl, which rebuilds every day.
Every crawl is compared automatically with the previous period or the previous crawl. The report opens on what changed, with new and worsening issues first.
What the report shows
The Issues report answers what to fix first in three modules, and every issue opens a dialog with its pages.
Top three cards: which issues come first?
The three cards at the top show the three issues that rank first: the highest severity first, then the most Google impressions, AI fetches and pages. Each card shows the issue's pages, its GSC impr and its AI fetches.
The line under the title names the URL section that holds the largest share of the issue's pages, such as "19 of 28 pages under /docs (13% of the crawl)", where the share in brackets is that section's share of the crawl. A fix in that section reaches those pages. When nothing needs action, the cards read "Nothing needs action on this crawl".
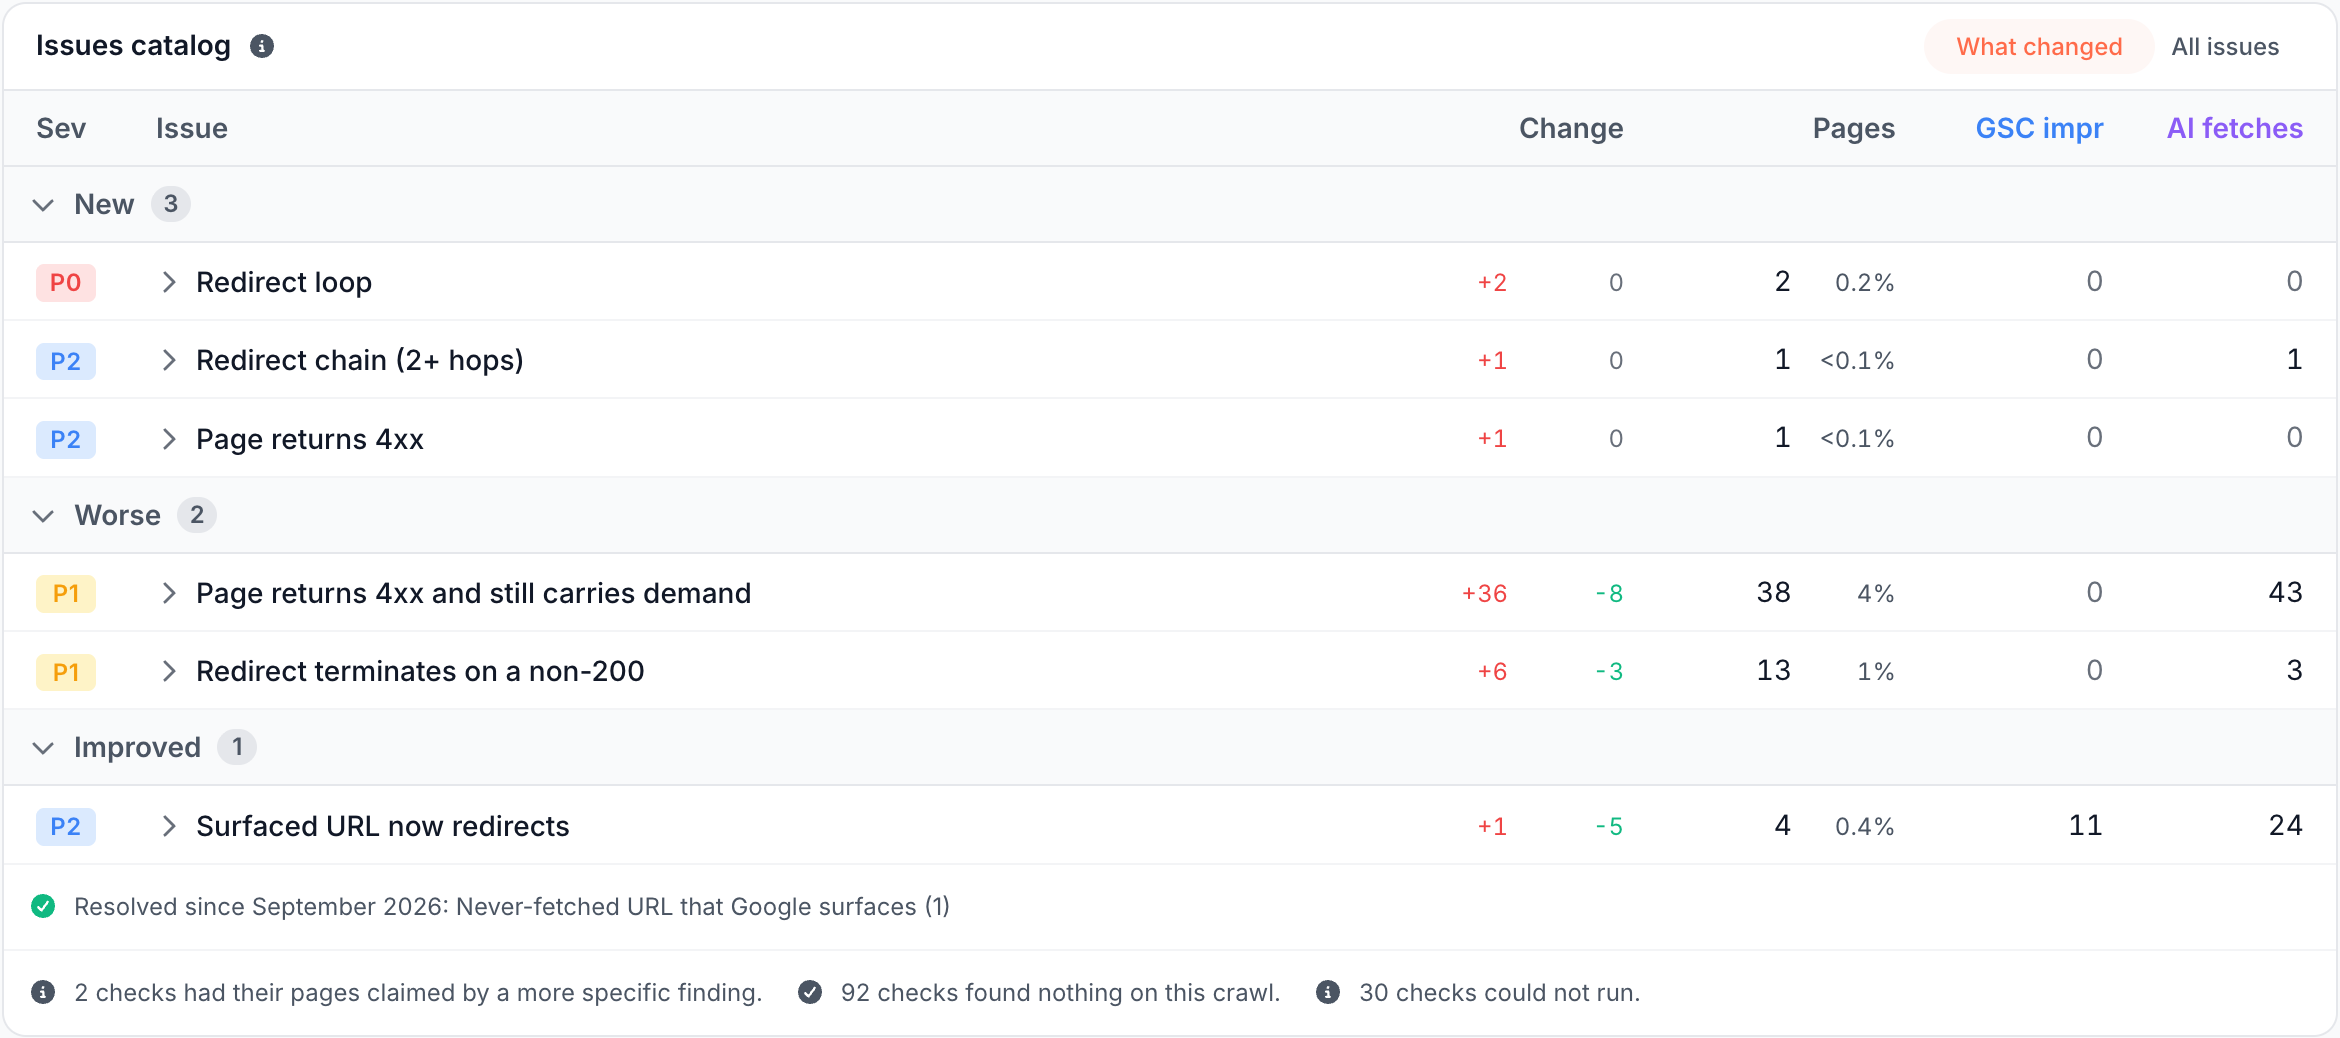
Issues catalog: what changed, and what is wrong overall?
The Issues catalog lists every check that found pages, with two lenses:
- What changed: issues grouped into New, Worse, Improved and Same count, different pages, compared with the comparison crawl. A line under the bands lists issues resolved since then. This lens opens first whenever something moved.
- All issues: every issue, grouped by category in the order a page goes from fetch to index to search.
Each row shows:
- Sev: the severity, from P0 to P3.
- Issue: the check's title. An Inferred chip marks a heuristic finding, such as an orphan page or a templated duplicate, that is worth a spot-check before you assign the fix.
- Change: the pages that newly carry the issue and the pages that left it since the comparison crawl, such as +36 and -8.
- Pages: the pages affected and their share of the crawl.
- GSC impr and AI fetches: the demand on those pages.
The last line counts the checks whose pages a more specific finding already lists, the checks that found nothing, and the checks that could not run. Opening a row adds the issue to the page URL, and a shared link opens the same issue.
While the checks run on a new crawl, the catalog reads "Recalculating issues for this crawl...". If a run fails, it reads "Issue data is not available for this crawl yet. Evaluation retries automatically in the background." and the next attempt starts on its own.
Issue dialog: which pages, and where?
Click an issue to open its dialog. The header shows the pages, their share of the crawl, the demand, and the movement since the comparison crawl, such as +36 in and 8 out. Click either figure to list the pages that entered or left. When the check itself changed between the two crawls, the header reads "This issue's definition changed since" and the crawl name instead of the movement.
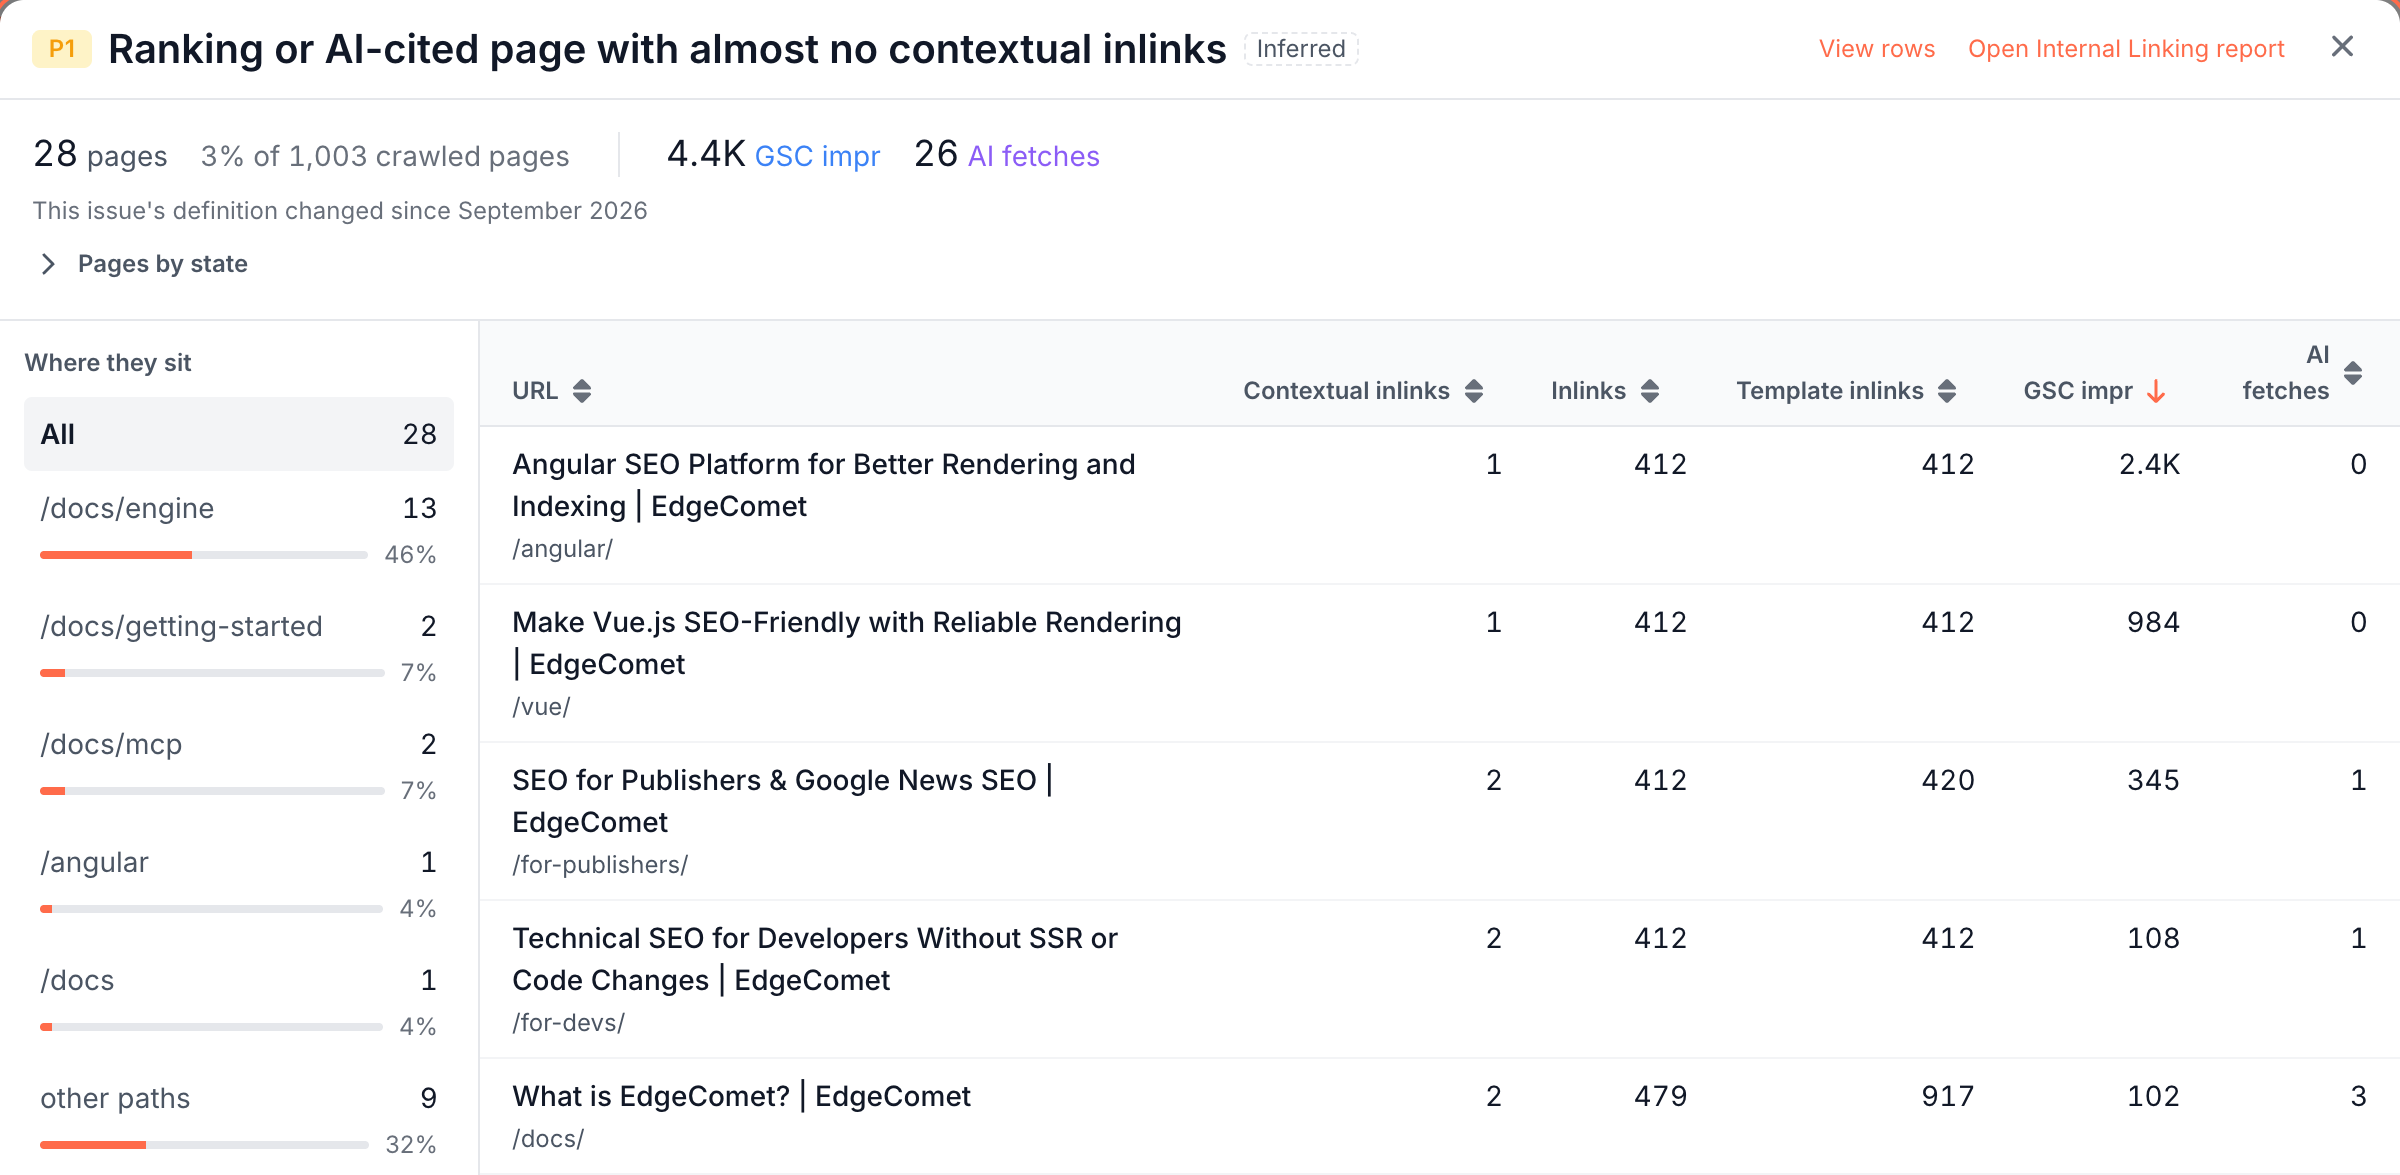
The dialog body has four parts:
- Pages by state: how the issue's pages split by indexability and URL shape, and how many are in your sitemap, earn impressions or clicks, were fetched by Googlebot or AI bots, or are orphaned.
- What this check found: the details the check stored, such as the offending link anchors.
- Where they sit: the URL sections that hold the pages. Click one to narrow the table to it.
- The table: the pages with the most Google impressions first, with the columns that prove the issue. Each URL has Page Analysis, which opens everything EdgeComet knows about the page, and Copy URL.

View rows opens every row of the issue in Data Explorer. On Indexation & Directives, Canonicals, Hreflang, On-Page Tags and Internal Linking issues, Open {category} report leads to that category's report, such as Canonicals.
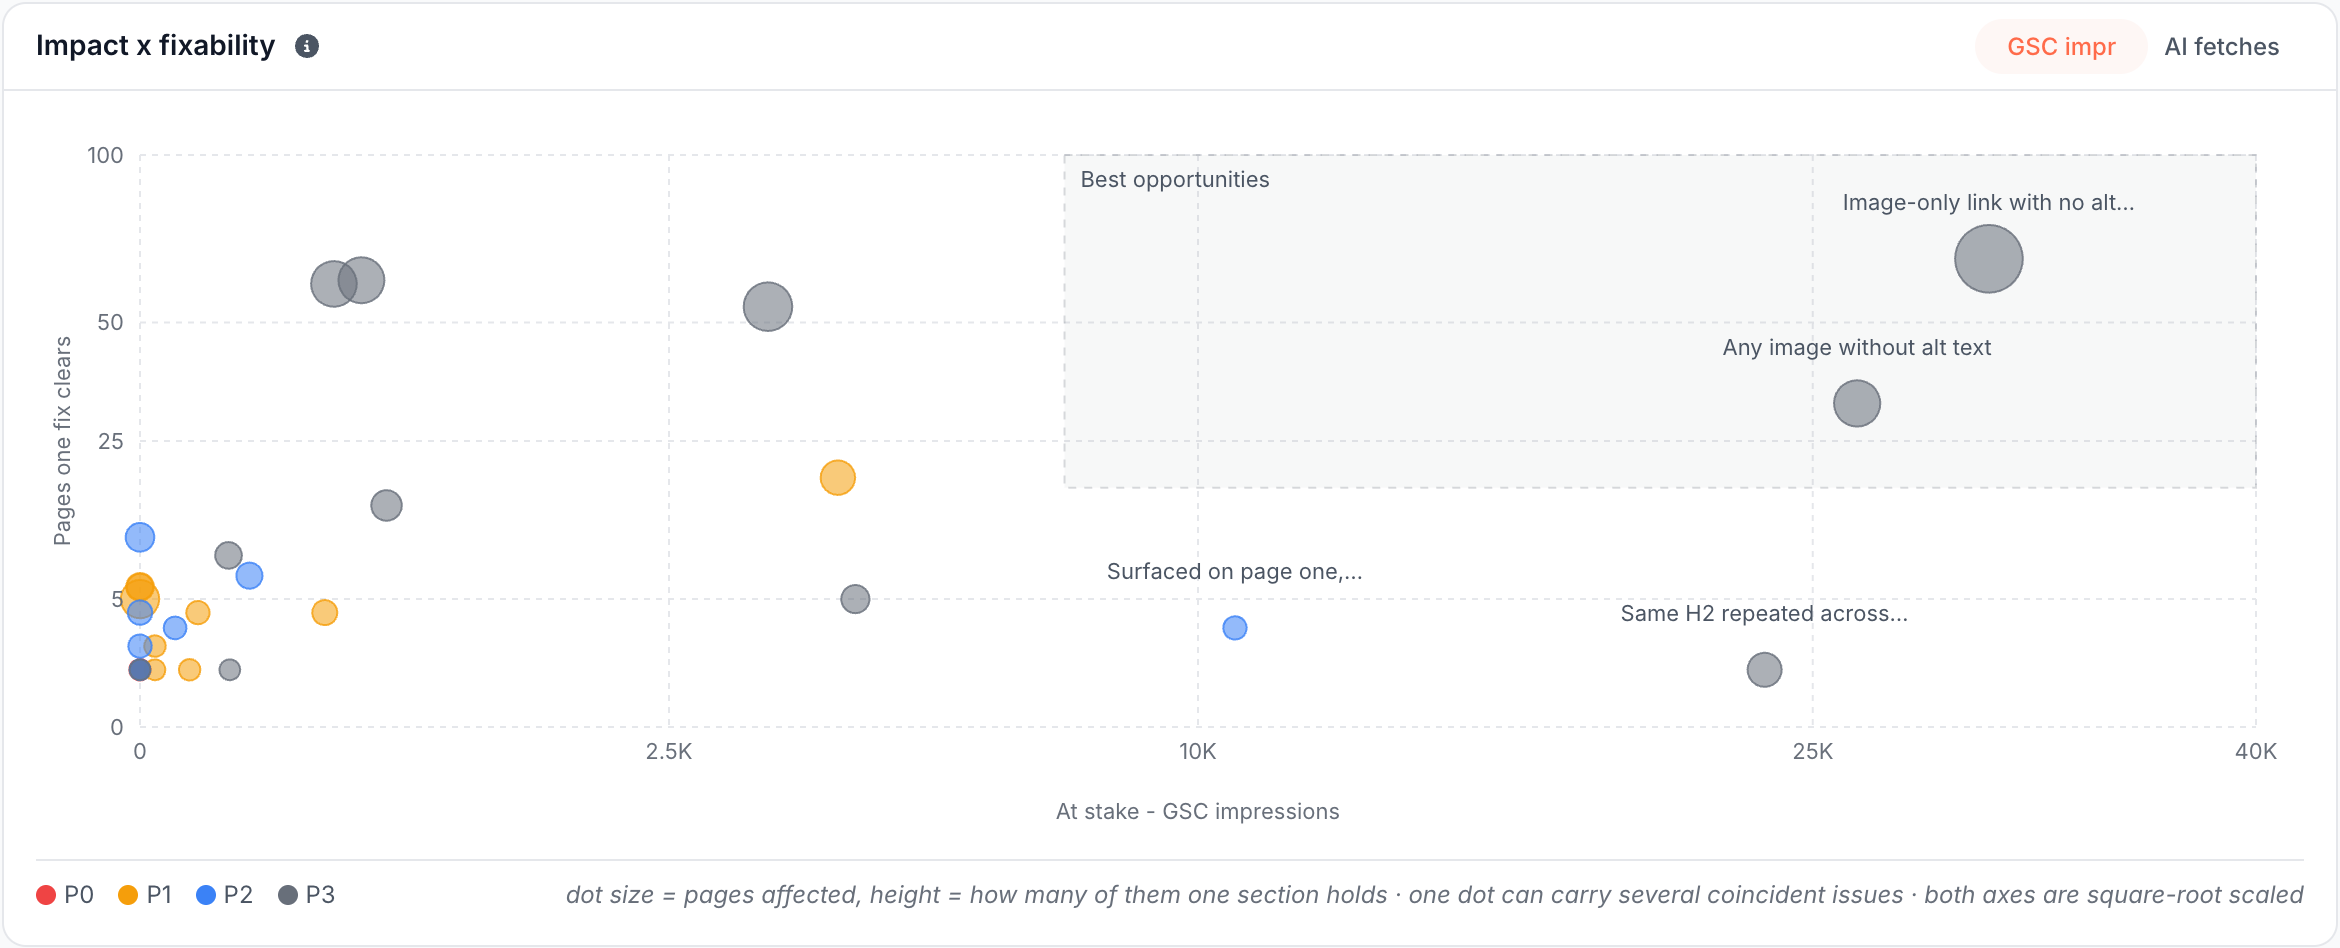
Impact x fixability: where does one fix clear the most?
The Impact x fixability chart plots one dot per issue. The horizontal axis is the demand at stake, in GSC impr or AI fetches. The vertical axis is how many of the issue's pages one URL section holds: a high dot is an issue one section-level fix can clear.
The shaded Best opportunities zone marks the issues with the most demand at stake and the most pages one fix reaches. Click a dot to open its issue.
How to read it
Severity tells you how serious a check is, and demand tells you how much traffic its pages carry.
Severity from P0 to P3
Every check has a fixed severity:
- P0: active loss or config conflict.
- P1: newly broken with demand.
- P2: strategic.
- P3: hygiene.
Severity belongs to the check, not to the page. Within a severity, demand orders the issues.
The Action Board priority starts from this severity and weighs the traffic at stake. A finding there can rank differently from its check here.
Demand: Google impressions and AI assistant fetches
Demand is the traffic a page carries in the crawl's window: its Google impressions from Search Console and its fetches by AI assistants answering users.
The two are shown side by side as GSC impr and AI fetches, and never added up, because one impression and one AI fetch are different things. Without Search Console, GSC impr shows a dash and checks that need it do not run.
Checks that could not run
A check whose evidence is missing does not report zero. It is listed under could not run, with the reason, in one of these groups:
- Waiting for enough history: your data starts inside the window the check measures an absence over, and the absence may only mean the site is new.
- Crawl data incomplete: too little of the crawl has the data the check reads, such as links or validated JSON-LD, and a result would be noise.
- Needs setup: the check needs Search Console, a product feed or link regions.
- Needs an extraction rule or setting: the check reads a value your custom extractions do not define yet, such as price or stock.
- Failed to evaluate: the check failed on this crawl, and the next crawl tries it again.
Issue categories and examples
The checks fall into 11 categories. Each has its own group in the All issues lens:
| Category | Example checks |
|---|---|
| Crawlability & Response | Redirect loop; Server error on a page with demand; Redirect chain (2+ hops) |
| Indexation & Directives | Noindex on a page with demand; Contradictory robots directives on one page; Crawled by Googlebot, never surfaced |
| Canonicals | Canonical points at a 4xx/5xx; Canonical target is itself canonicalized elsewhere; Canonical loop (A -> B -> A) |
| Internal Linking | Broken links in the main menu; Orphan indexable page; Internal links point at redirects |
| On-Page Tags | Exact-duplicate titles - many URLs compete for one head query; Missing title - Google invents one; Multiple H1s on one page |
| Content | Thin page that Google surfaces - refresh candidate; 200 response that reads as a not-found page; Long-form page with no H2 at all |
| Hreflang | No self-reference - the whole set may be ignored; Alternate does not point back; Unparseable language or region code |
| URL & Transport Hygiene | Indexable page served over http://; Internal search results indexable; Uppercase characters in the path |
| Structured Data & Images | JSON-LD page entity missing a Google-required property; No JSON-LD BreadcrumbList on a deep indexable page; Any image without alt text |
| Search Performance | Ranking on page two with a query worth pushing; Several pages competing for the same non-brand query |
| Catalog Health | Page price differs from the feed; Out-of-stock products; Thin listing pages |
Search Performance checks count the URLs Search Console reports on, not crawl pages, and show no change since the comparison crawl. Catalog Health checks read your product feed and custom extractions. The checks on product and listing pages also appear on the Shelf Edge e-commerce reports. See Product pages against the feed.
Why a page left an issue
A page leaves an issue in one of two ways, shown in the Why it left column of the pages that left:
- Re-crawled and clear: bots fetched the page again and the problem is gone.
- Not re-observed: no bot fetched the page in the newer crawl's window, and it is not confirmed clear.
What to do next
- Fix it at the edge. Titles, meta descriptions, canonicals and robots directives can change without a release: start from the matching Action Board finding, or write an Edge SEO rule.
- Hand it to developers. For template and link problems, View rows gives the full list of pages to attach to the ticket.
- Narrow it. Filter in the header limits every module to a saved segment, such as product pages. The filter narrows the report, not the crawl.
- Ask about it. Ask in the header starts with "Which issue affects most pages?", "Where would one fix help most?" and "What changed since the baseline?".
- Confirm the fix. A fixed page leaves the issue once it is fetched again and the Current crawl rebuilds, which happens every day. To see the change sooner, rebuild the Current crawl after the fixed pages are fetched again.
Where to find it
In the dashboard: Evergreen Crawl > Issues. The page title reads Crawl Issues. The crawl selector in the header, Current by default, switches to an earlier crawl.