

Search Console pages and keywords joined with bot requests
EdgeComet Data Explorer > Search Console lists every page and every keyword your site earned in Google Search, with clicks, impressions, CTR and average position for the period and the change against the period before. Also called a Search Console data export or GSC explorer.
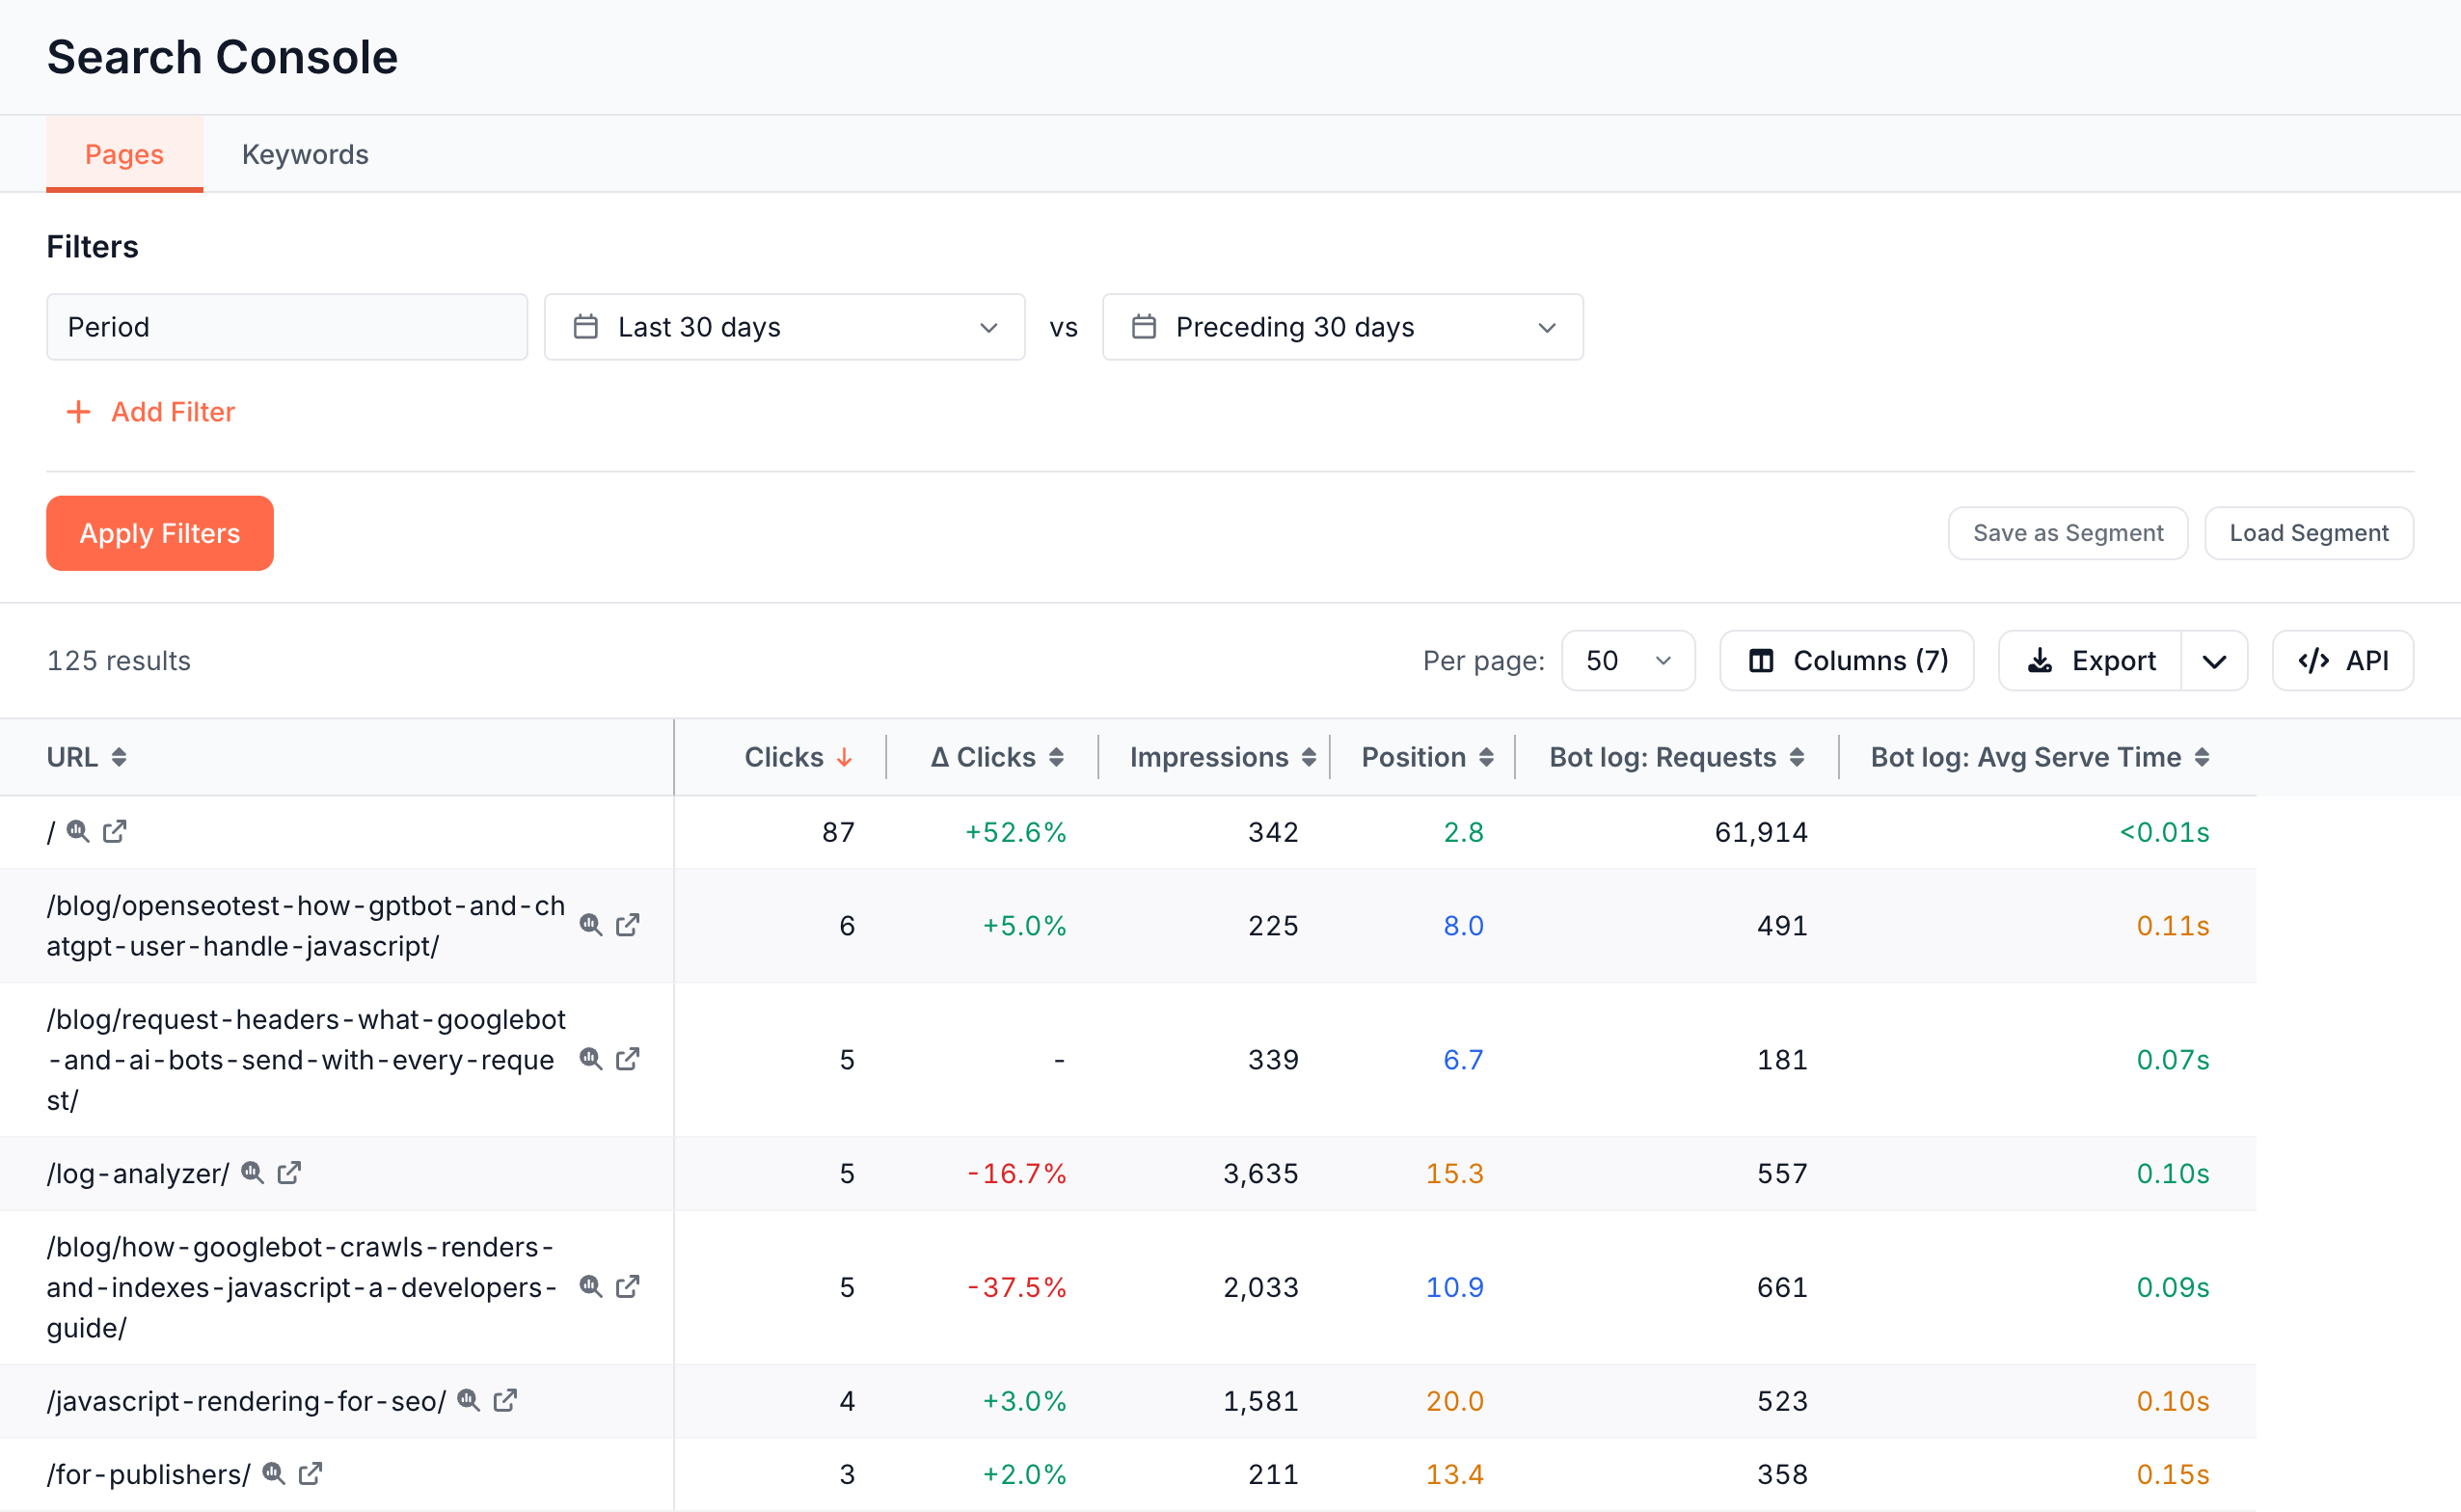
The tables read the Search Console data EdgeComet imports for your site, and each row can carry the same page's Bot log columns: how often Googlebot and AI bots requested it, how fast it was served, and whether its title changed.
There are two tabs:
- Pages: one row per URL, as Search Console reports it.
- Keywords: one row per URL and keyword pair.
Before you start
Connect Google Search Console to the website. EdgeComet imports the 180 days before the connection, then new days as Google reports them. See Connect Google Search Console.
The tables read Google web search results, like every EdgeComet report. See What EdgeComet imports.
Pages: one row per URL
Pages opens with URL, Clicks, Δ Clicks, Impressions, Δ Impressions, CTR, Δ CTR (pp), Position and Position change, most clicks first.
- Clicks and Impressions add up the period. CTR is clicks divided by impressions, and Position is the average position weighted by impressions.
- Δ Clicks and Δ Impressions are the change in percent against the compare window. Δ CTR (pp) is the change in percentage points.
- Position change is the earlier position minus the current one. A positive value means the page moved up.
Under Columns, the Decay group adds Prior clicks, Prior impressions, Decay bucket and Decay cause. See Find pages and keywords losing traffic.
A URL with a # fragment, such as a jump link Google showed in results, is its own row.
Keywords: one row per keyword and page
Keywords adds Keyword after URL, with the same numbers per pair. A keyword that two of your pages rank for shows as two rows, one per page.
Filters that only this tab has:
- Brand: Brand or Non-brand, from your branded keywords.
- Opportunity: Striking distance, Below-curve CTR, Zero-click high-impression or Cannibalized. See Opportunities this period.
- Priority: Critical, Needs attention or Monitor, for cannibalized keywords. See Find keyword cannibalization in Search Console data.
- Movement: Improved, New or Declined against the compare window.
- Fan-out queries and Trash keywords: Yes or No. See Fan-out and trash keyword filters.
- Keyword and Keyword length: match the text or the number of words.
The Fan-out column group adds what EdgeComet's AI classification says about each fan-out keyword: Question, Topic, Type, Intent, Entities and Lane. First seen and Last seen give the first and last day the keyword drew an impression. See Fan-out queries: what AI assistants search for about you.
Pages and Keywords keep your filters and period when you switch between them. Filters that only Keywords has drop on Pages, and each tab keeps its own columns and sort.
Compare with the previous period
The Period row always has a compare window after vs. By default it is the period of the same length just before, such as Preceding 30 days for Last 30 days. It feeds the Δ columns, Position change, Prior clicks, Prior impressions, Movement and the decay columns.
Pick another preset, or Custom after vs, such as the 28 days before a site migration. See Compare with an earlier period.
The period ends on the last day Search Console has reported for your site, about 3 days before today. A Last 30 days period therefore holds fewer than 30 days of data. See What EdgeComet imports.
Add bot data to Search Console rows
The Bot log column group brings each page's bot requests into the row, prefixed Bot log:, such as Bot log: Requests, Bot log: Avg Serve Time, Bot log: Error Rate and Bot log: Word Count. It also has the page's SEO changes, such as Bot log: Old Title and Bot log: New Title, and one column per custom extraction rule.
The Bot log: ... filters keep pages with at least one bot request that matches the rule, such as Bot log: Bot Type AI Bots or Bot log: Status code >= 500. Bot log: Requested set to No keeps pages that Google showed in search but no bot requested through EdgeComet.
The bot columns and filters cover the period and the compare window together, and leave out requests from fake bots. The columns count requests from every bot. The Bot log: ... filters decide which pages stay, not what the columns count.
EdgeComet joins the two sources by URL, without SQL or a data warehouse.
Questions the joined table answers:
- Which pages earn clicks but few bot requests? Add Bot log: Requests and sort by Clicks. For Googlebot alone, use Bot log > Pages with Bot set to Googlebot Desktop and Googlebot Mobile and GSC: Clicks added.
- Did a title change come with a click drop? Add Bot log: Old Title and Bot log: New Title, sort by Δ Clicks.
- Which ranking pages are slow for bots? Add Bot log: Avg Serve Time, sort it from the highest and read Impressions beside it.
How this differs from the Search Console interface
Google says Search Console data "has limits of 1,000 rows via the interface or up to 50,000 via API per day" (Google Search Central blog, 2022-10-19), and the interface shows Google data only. The Data Explorer tables page through every page and keyword EdgeComet imported through the Search Console API, and put the bot requests for the same URL in the same row. See How Search differs from the Search Console interface.
What you get from the join:
- No export, SQL or warehouse to build. Clicks and bot requests per page sit in one table, filtered and sorted together.
- Both directions. Start from search data and add bot columns here, or start from the Bot log Pages tab and add Search Console columns.
- Every row exports. Download every row as CSV, or open the table in Google Sheets. See Export Data Explorer tables to CSV or Google Sheets.
Some keywords never reach any table, in Search Console or in EdgeComet, because Google withholds them. See Anonymized queries.
The same tables inside reports
Several Search reports show these tables as tabs, with the report's filters already set:
- Search > Keywords: the Keywords, Pages and Opportunities tabs. See Keywords and Pages tabs.
- Search > Traffic Decay: the Decaying pages and Decaying keywords tabs. See Find pages and keywords losing traffic.
- Search > Fan-out Queries: the Keywords tab. See Fan-out queries: what AI assistants search for about you.
- Search > Cannibalization: the Cannibalized keywords tab. See Find keyword cannibalization in Search Console data.
Where to find it
In the dashboard: Data Explorer > Search Console, with the tabs Pages and Keywords.