

Track Google search performance: clicks, impressions, CTR and position
EdgeComet's Search Overview report answers one question: are you winning or losing Google search this period? It shows the clicks, impressions, click-through rate (CTR) and average position from your Google Search Console data, each compared with the previous period of the same length. Also called a Search Console performance report or an organic search performance report.
The report needs a connected Search Console property. See Connect Google Search Console.
What the report shows
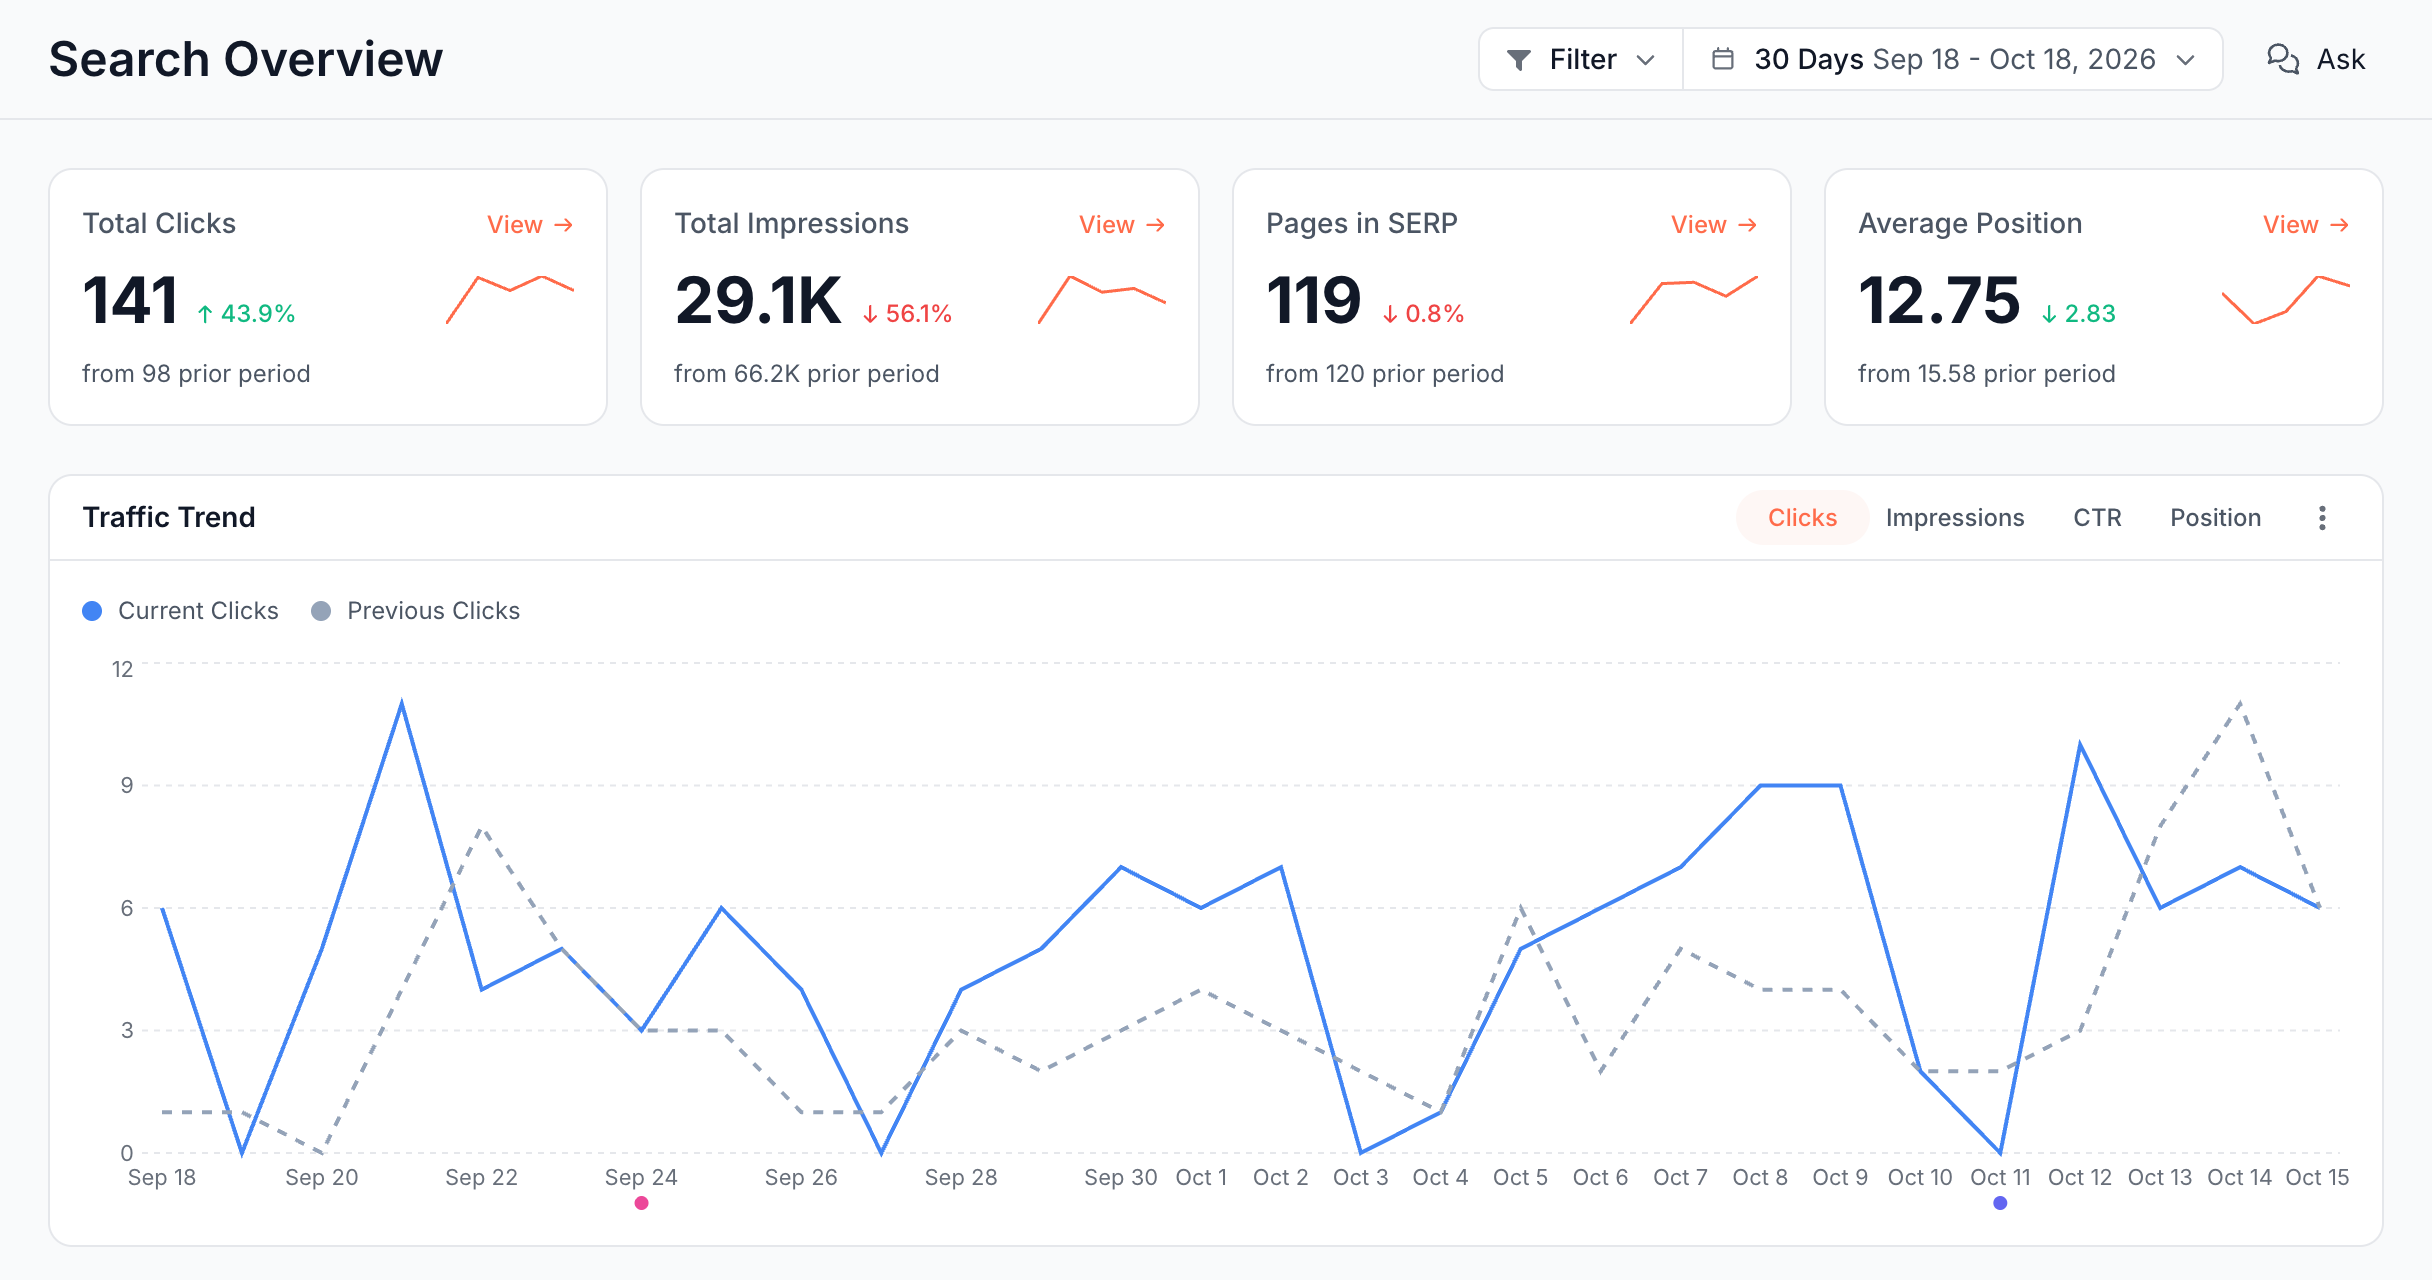
Search Overview has four stat cards, then seven cards from top to bottom. Every card reads Google web search results and ends at the last complete Search Console day, about 3 days ago (see What EdgeComet imports). The period, filter, drill-downs and Ask panel work as on every Search report: see Filter, drill down and ask.
Stat cards: how much search traffic did you get?
Four cards show the totals for the period:
- Total Clicks: clicks from Google search to your site.
- Total Impressions: how often your pages appeared in Google search results.
- Pages in SERP: how many distinct URLs appeared in search results at least once.
- Average Position: where your pages ranked on average. Lower is better. See How average position is calculated.
Each card has a sparkline, the change against the previous period and the line "from {value} prior period". View opens the pages behind the number in Data Explorer.
With no filter applied, Total Clicks, Total Impressions and Average Position show Search Console's site figure, which runs lower than the sum of the pages behind it.
How average position is calculated
Average position is weighted by impressions. A keyword shown 1,000 times at position 3 counts a hundred times more than a keyword shown 10 times at position 30. Position 1 is the top result.
This matches Google's definition: "In Search Console, the metric is shown as average position, which averages the position value for all impressions" (Google Search Console Help).
Every position figure in the Search reports, from position buckets to striking distance, uses this impression-weighted position.
Traffic Trend: how does this period compare with the last one?
Traffic Trend draws the current period as a solid line and the previous period as a dashed line, day by day. The toggle switches between Clicks, Impressions, CTR and Position. On Position, the axis is reversed, with position 1 at the top.
Click a point on the current line to open that day's pages in Data Explorer. Chart annotations, such as a release you marked, show on the line.
Keyword Movement: which keywords gained and lost clicks?
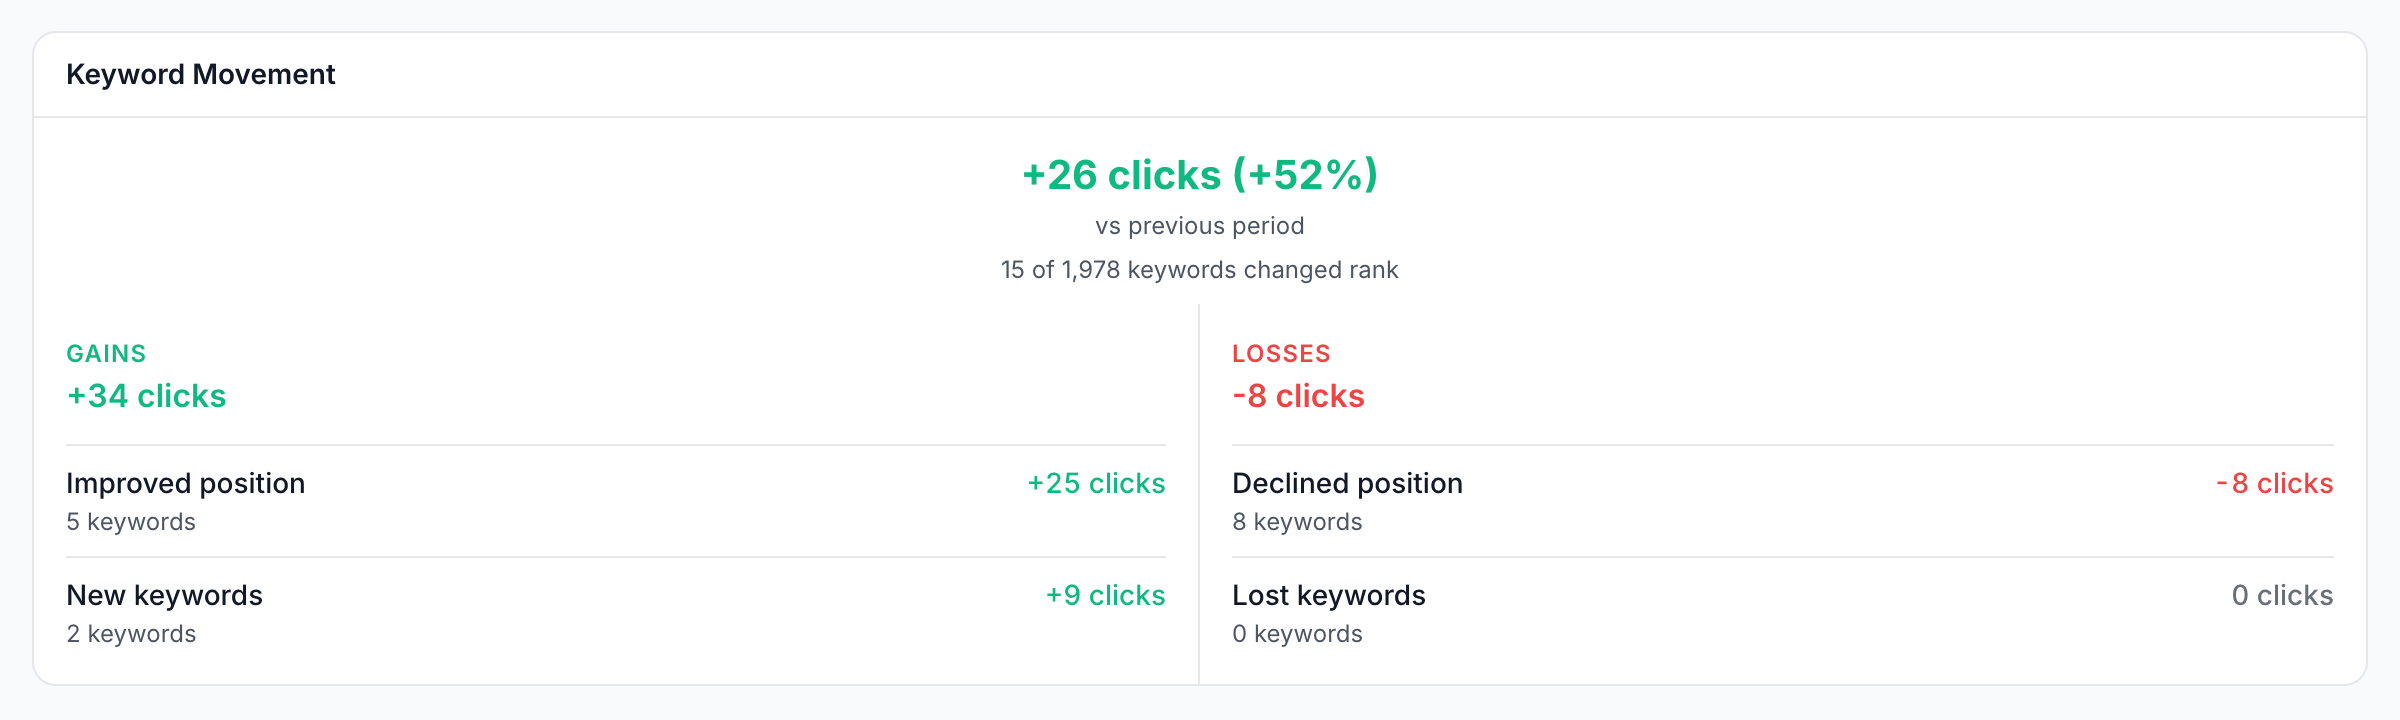
Keyword Movement shows the net change in clicks against the previous period, such as "+1,240 clicks (+8%)", and how many keywords changed, as "{n} of {m} keywords changed rank". Two columns split the change: Gains holds Improved position and New keywords, and Losses holds Declined position and Lost keywords.
Each group shows its number of keywords and its click change. A keyword counts once for each page it ranks with.
A keyword lands in a group by its click change, not its position change:
- New keywords: it earns clicks now and had no impressions in the previous period.
- Improved position: it earns more clicks than in the previous period.
- Declined position: it earns fewer clicks than in the previous period.
- Lost keywords: it had clicks in the previous period and no impressions now.
Keywords whose clicks did not change are not counted. The Improved, New and Declined counts open the matching keywords in Data Explorer. The empty state reads "No keyword movement in this period".
Position Distribution: where do your keywords rank?
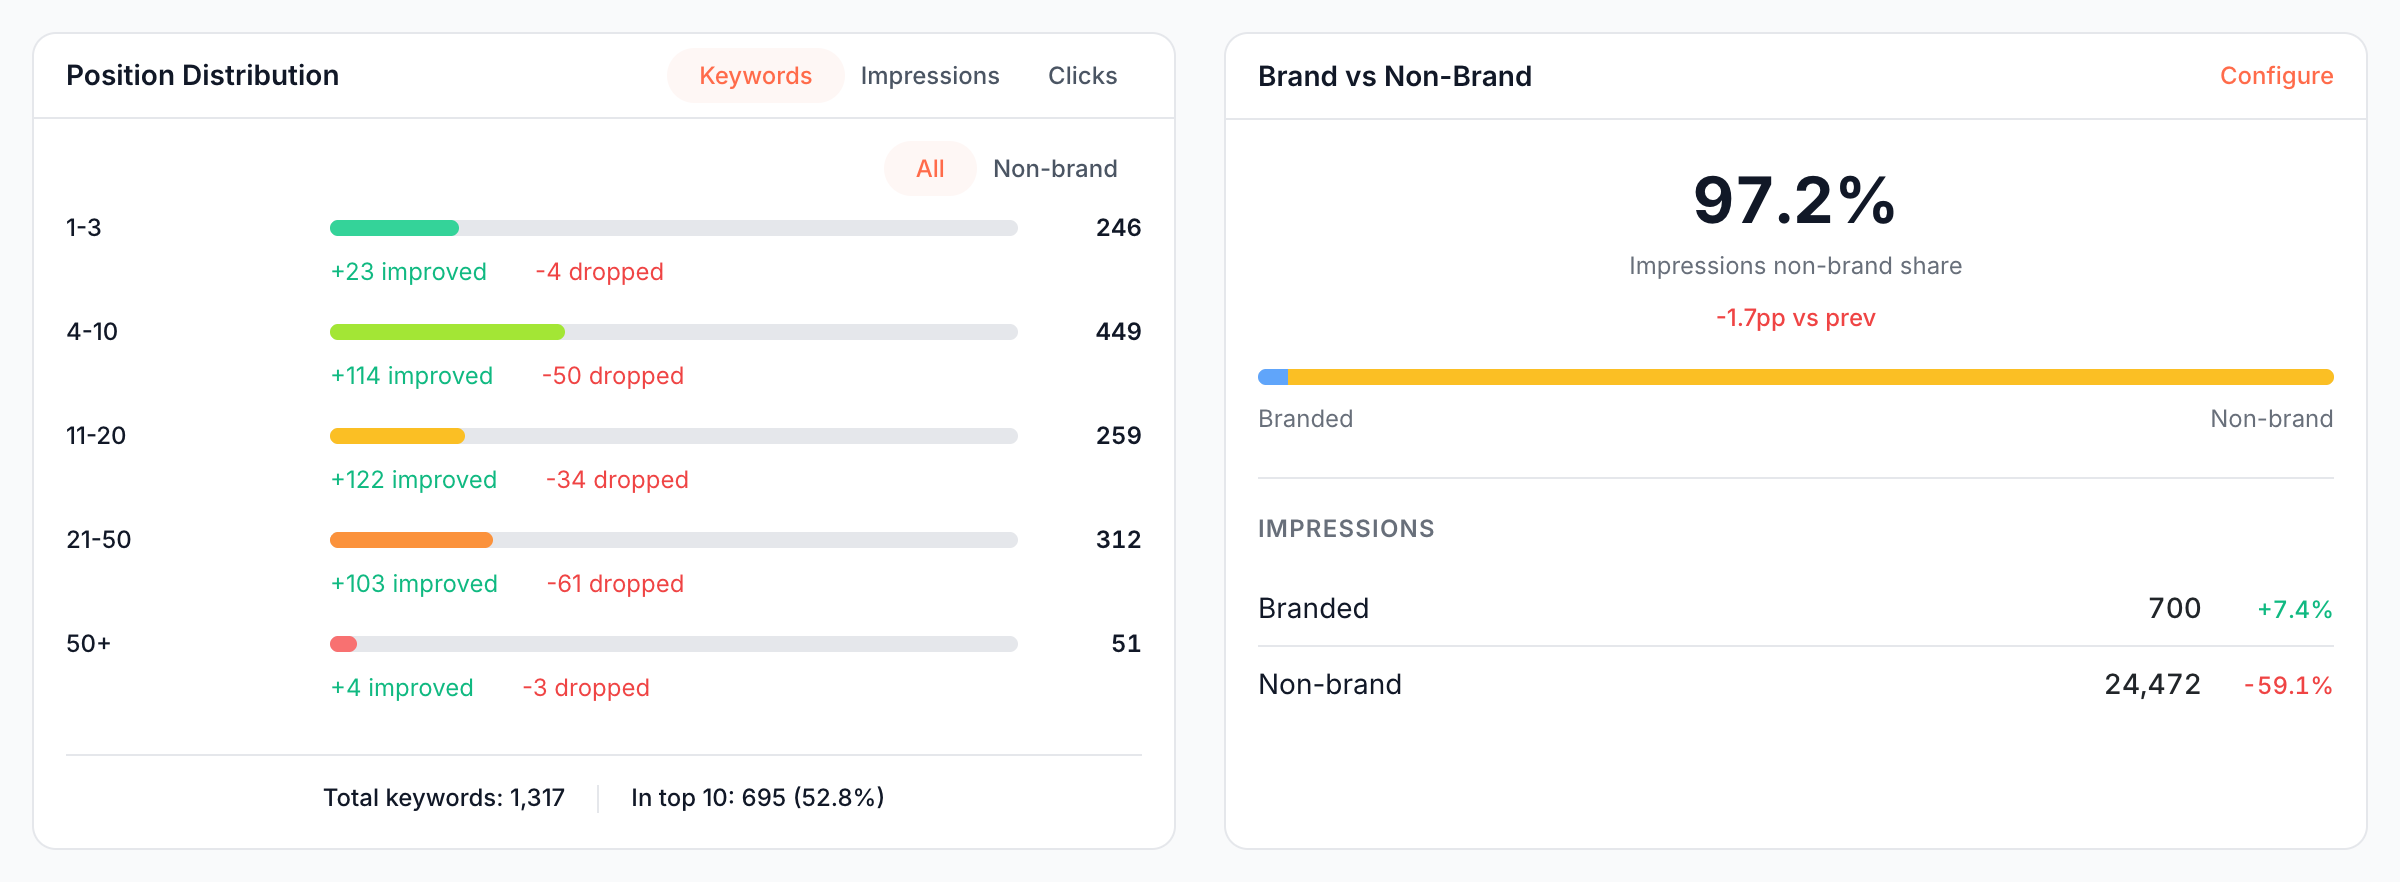
Position Distribution counts your keywords in five buckets by their average position in the current period: 1-3, 4-10, 11-20, 21-50 and 50+.
- The toggle measures the buckets by Keywords, Impressions or Clicks.
- Under each bucket, "+N improved" and "-N dropped" count the keywords whose position moved up or down by at least one place against the previous period.
- The footer shows the total and "In top 10", the count and share in buckets 1-3 and 4-10.
- When you have branded keywords, a toggle switches between All and Non-brand keywords.
The empty state reads "No position data for this period".
Brand vs Non-Brand: how much of your visibility depends on your brand name?
Brand vs Non-Brand leads with the non-brand share of your impressions, labeled "Impressions non-brand share", and its change in percentage points, such as "+2.1pp vs prev". A bar and two rows give the Branded and Non-brand impressions with their change, each opening its keywords in Data Explorer.
The split uses your branded keywords, and Configure in the card header opens the list.
The empty state reads "No brand split for this period".
Device Comparison: does mobile perform like desktop?
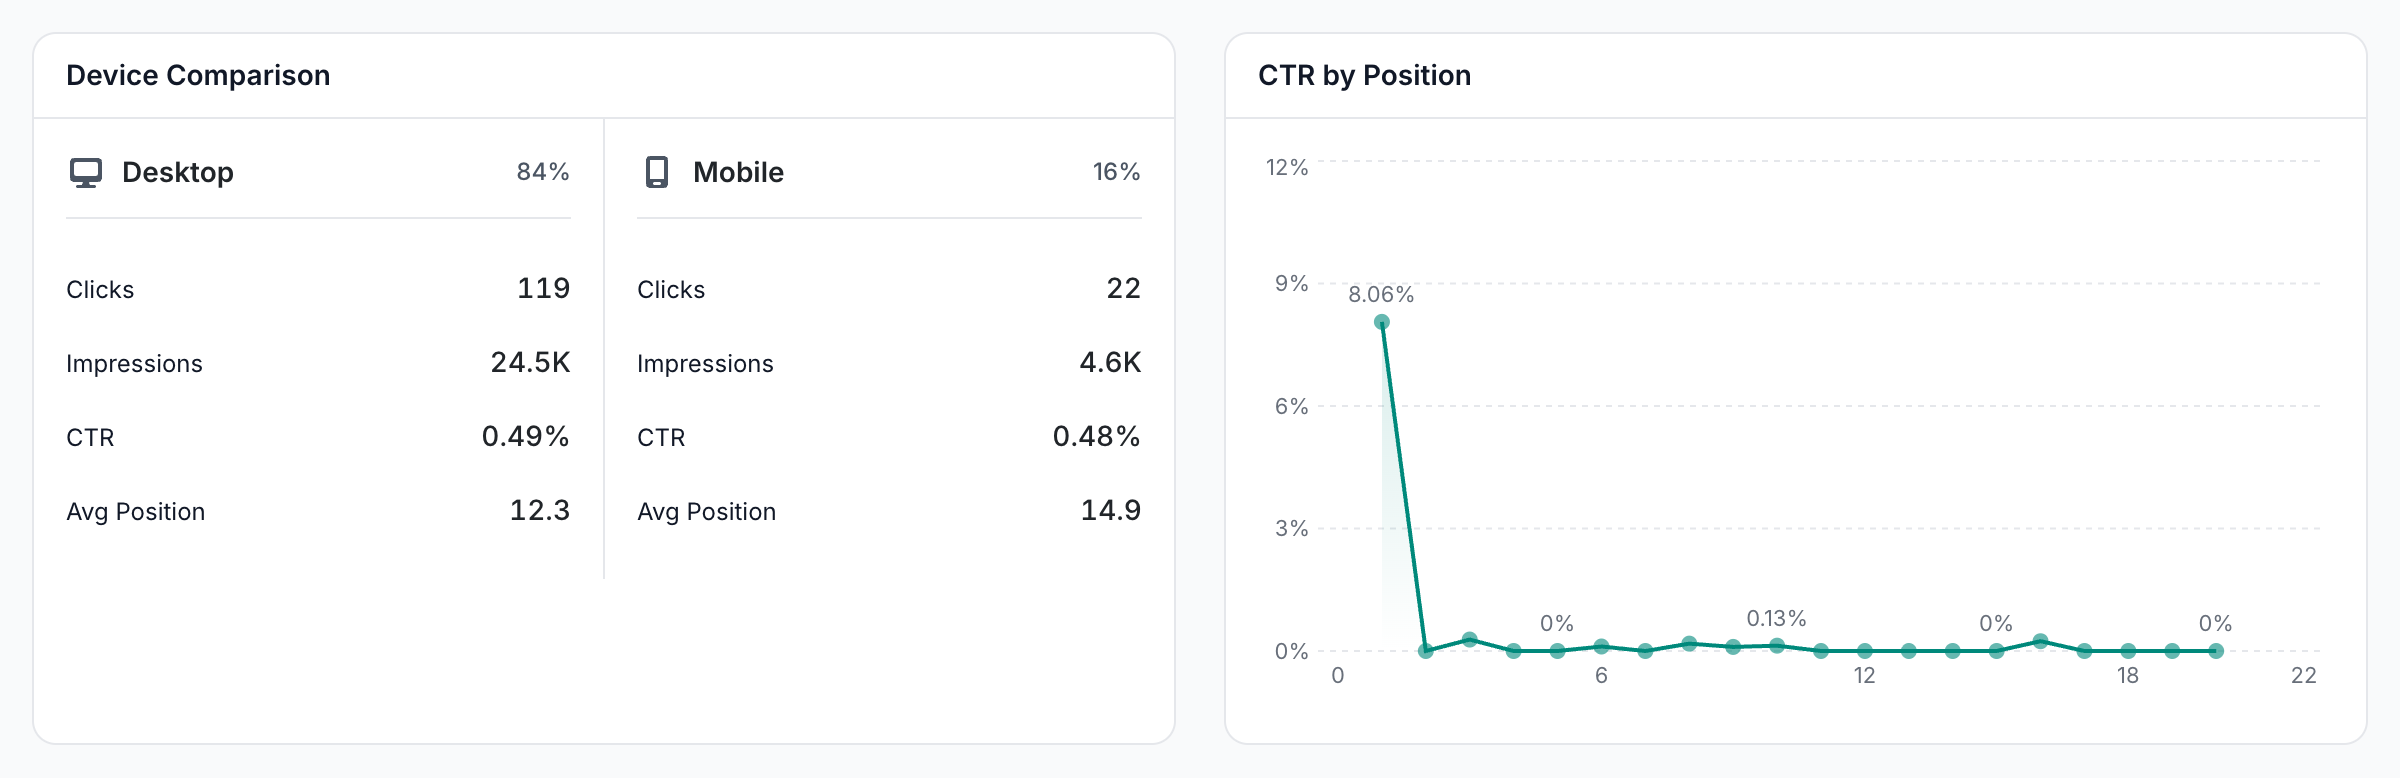
Device Comparison puts Desktop and Mobile side by side, each with Clicks, Impressions, CTR, Avg Position and its share of clicks. Mobile includes tablets. The empty state reads "No device data for this period".
CTR by Position: what CTR does each position earn on your site?
CTR by Position is your site's own click-through rate curve for positions 1 to 20. EdgeComet places each keyword at its average position for the period, rounded to a whole number, then divides the clicks by the impressions of all keywords at that position.
Hover a point to see the CTR and the Sample size, the number of keywords behind it. A position with a small sample swings more from period to period.
The curve shows what a ranking is worth on your site rather than an industry average, and the Keywords report uses it to find keywords below it. The empty state reads "No CTR-by-position data for this period".
Segment Performance: which sections of your site win search traffic?
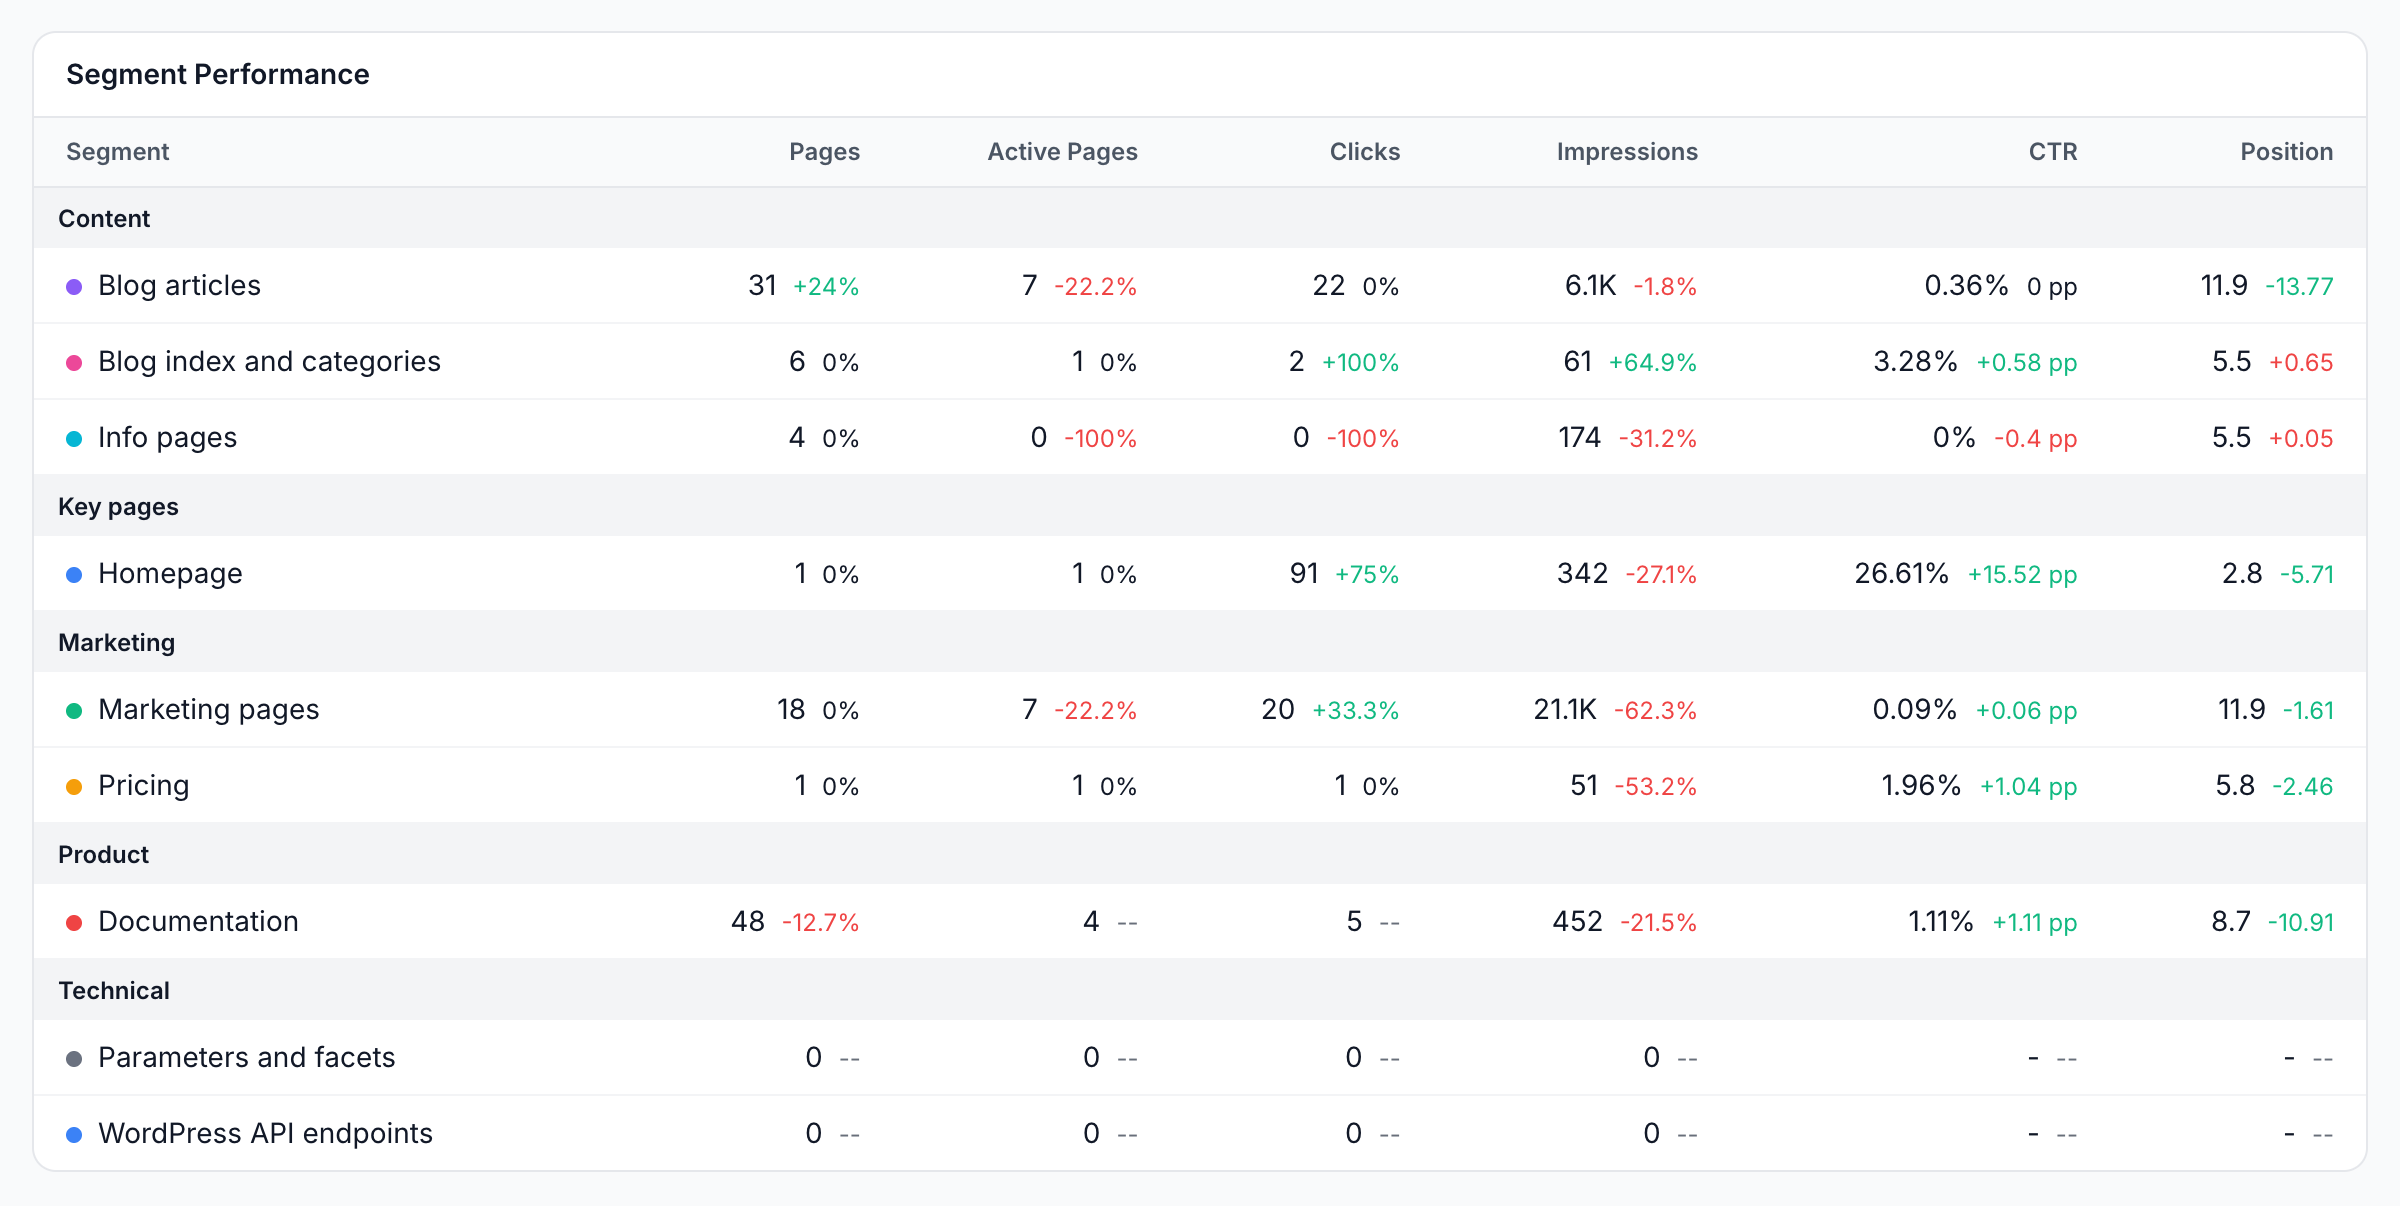
Segment Performance gives each segment of your site, such as product pages or blog articles, its own row: Pages, Active Pages (pages with at least one click), Clicks, Impressions, CTR and Position, each with its change against the previous period.
EdgeComet creates segments from your own data after the first import, and you can edit them under Configuration > Segments. A site with no segments shows "No segments configured" and a Manage Segments link.
When Search Console is not connected
Without a connected property, the report shows the Connect Google Search Console card: "Import clicks, impressions, CTR, and average position straight from Search Console to see how your pages perform in Google search." See Connect Google Search Console.
How to read it
Start with the stat cards and Traffic Trend, then use the other cards to find the cause:
- Impressions rise, clicks stay flat. You appear for more queries without winning the click. Check CTR by Position and the Keywords report's opportunities.
- Clicks fall while position holds. Fewer searchers click at the same rank. Traffic Decay splits lost clicks into position, CTR and impression drops.
- A small net change with many keywords moved. Gains are hiding losses. Compare the Gains and Losses columns of Keyword Movement.
- The non-brand share falls. More of your visibility comes from people who already know your brand, and less from new searches.
- A segment has many pages and few active pages. Pages in that section appear in search without earning clicks.
EdgeComet's numbers can differ from the Search Console interface for the same dates. See Why numbers differ from the Search Console interface.
How this differs from the Search Console Performance report
Search Overview reads the same data as the Search Console Performance report, with the same definitions, such as average position. What changes is the work around the numbers:
- Movement is counted for you. Every card compares the period with the previous one, and Keyword Movement and Position Distribution count the keywords that gained, lost, rose or dropped.
- Your brand split is set up for you. EdgeComet suggests your branded keywords with AI, and every brand split uses them.
- Your site sections get their own rows. Segment Performance reports by page type, not only by URL.
- Search data sits next to bot data. Every View opens Data Explorer, where you can add Bot log columns and filters to the same pages, such as the requests Googlebot and AI bots made, beside clicks and impressions.
What to do next
- Find the keywords to work on: the Keywords report lists striking distance keywords and opportunities with the clicks you could recover.
- Find pages losing traffic: Traffic Decay lists decaying pages and keywords with the likely cause.
- Find pages competing for one keyword: see Cannibalization.
- Get alerted: Search Console alerts tell you when pages or queries lose their clicks.
- Ask: the Ask panel on the report starts with "Did impressions or CTR fall?", "Are rankings improving?" and "Is mobile CTR behind desktop?". See Ask overview.
- Fix it: the Action Board turns search data into findings with the search traffic at stake.
Where to find it
In the dashboard: Search > Overview. The page title is Search Overview.